OEE Software for Food Processing Manufacturing Plants: Improve Production Efficiency and Visibility
Food processing plants operate in a demanding manufacturing environment where production efficiency, product quality, equipment reliability, and timely order fulfilment are all important. From raw material handling and mixing to processing, filling, packaging, and labelling, every stage must work together to maintain consistent production.
However, managing these operations efficiently can be challenging. Processing machines may experience unexpected stoppages, production speeds may fluctuate, changeovers can consume valuable time, and quality-related issues may result in rejected products or rework.
When multiple production lines operate across different shifts, manually collecting machine and production information becomes increasingly difficult. Managers may know how much product was manufactured, but not always understand why actual output was lower than expected.
This is where Food Industry OEE Software becomes valuable. It helps food manufacturers measure Overall Equipment Effectiveness (OEE) by tracking availability, performance, and quality.
With reliable production information, food plant managers can identify recurring losses, understand machine performance, and make better decisions about production planning and operational improvement.
What Is Food Industry OEE Software?
Food Industry OEE Software is a production monitoring solution that measures the effectiveness of manufacturing equipment used in food processing and packaging operations.
OEE stands for Overall Equipment Effectiveness . It combines three key performance factors:
Availability: How much of the planned production time equipment was actually operating.
Performance: Whether equipment operated at its expected production rate.
Quality: How much of the total output met the required quality standards.
A food manufacturing facility may include several types of equipment, depending on the products and processes involved:
Raw material handling and feeding systems
Mixing and blending machines
Grinding and milling equipment
Cooking and processing systems
Filling and dosing machines
Bottling and packaging lines
Sealing and labelling machines
Inspection and sorting equipment
Each stage contributes to the overall production process. A stoppage in one area can affect material flow, machine utilisation, and output in connected operations.
OEE software helps manufacturers understand equipment performance through structured production data rather than relying only on manual registers and end-of-shift reports.
Depending on the machine connectivity and system configuration, manufacturers can monitor:
Machine running and stopped status
Production output
Actual and expected production rates
Downtime duration and reasons
Good and rejected production
Shift-wise performance
Availability, performance, and quality percentages
Overall OEE
This information provides a clearer picture of how effectively the production facility is using its available manufacturing capacity.
Why Food Processing Plants Need OEE Monitoring
Food manufacturing involves different production stages, each with its own operating requirements and potential sources of production loss.
Several common challenges make OEE monitoring important.
1. Unexpected Equipment Downtime
Food processing equipment may stop because of mechanical faults, electrical problems, sensor failures, material shortages, equipment blockages, or maintenance requirements.
For example, a processing machine may stop unexpectedly, interrupting the supply of material to downstream filling or packaging equipment.
If these stoppages are recorded manually, their duration and reasons may not always be captured accurately.
OEE monitoring helps record machine interruptions and provides visibility into recurring downtime patterns.
2. Production Speed Variations
Food processing equipment often operates at defined production rates based on product type, machine configuration, material characteristics, and process requirements.
Actual production speed may decrease because of equipment condition, process adjustments, material feeding issues, or operational interruptions.
Monitoring actual output against approved production rates helps managers identify performance losses.
3. Changeover and Cleaning Time
Food manufacturing facilities may produce multiple products using the same equipment.
Changing products or production batches may require cleaning, sanitisation, equipment adjustments, material replacement, and quality checks.
These activities are important for maintaining hygiene and product requirements, but they also need to be considered when analysing production time.
Tracking changeover and cleaning activities separately helps managers understand their impact on production schedules and identify opportunities to improve preparation and coordination.
Cleaning and sanitation activities should always follow the facility's applicable food safety and hygiene procedures.
4. Quality Losses and Product Rejection
Food products must meet defined quality and safety requirements.
Production losses may occur because of incorrect filling quantities, damaged packaging, sealing problems, inconsistent processing, contamination concerns, or other quality-related issues.
Rejected products and rework reduce the quantity of acceptable output.
Including quality data in OEE calculations helps manufacturers understand how these losses affect production effectiveness.
5. Limited Visibility Across Production Lines
A food processing plant may operate several production lines with different machines, product types, and operating schedules.
When every line maintains separate spreadsheets or manual records, comparing performance becomes difficult.
A centralised monitoring system can provide a consolidated view of machine status, production output, downtime, and efficiency across the facility.
Understanding OEE for Food Processing Equipment
OEE measures how effectively manufacturing equipment uses its planned production time.
The standard formula is:
OEE = Availability × Performance × Quality
Each factor represents a different category of production loss.
1. Availability
Availability measures the percentage of planned production time during which equipment was actually operating.
Availability = Operating Time ÷ Planned Production Time × 100
For example:
Planned production time: 480 minutes
Total downtime: 48 minutes
Actual operating time: 432 minutes
Availability:
432 ÷ 480 × 100 = 90%
This means the equipment operated for 90% of its planned production time.
2. Performance
Performance measures how closely actual production matches the expected production rate.
Performance = Ideal Cycle Time × Total Units Produced ÷ Operating Time × 100
For example, consider a food processing line with:
Ideal production rate: 100 units per minute
Operating time: 432 minutes
Actual production: 41,040 units
Expected output:
100 × 432 = 43,200 units
Performance:
41,040 ÷ 43,200 × 100 = 95%
This indicates that the line achieved 95% of its expected production output while operating.
For processes measured in kilograms, litres, or batches rather than individual units, manufacturers should use a consistent production unit and corresponding reference rate.
3. Quality
Quality measures the percentage of total production that meets the required standards.
Quality = Good Units ÷ Total Units Produced × 100
Suppose the production line manufactures 41,040 units, of which 40,219 meet quality requirements.
Quality:
40,219 ÷ 41,040 × 100 = 98% approximately
The remaining units represent quality losses.
4. Overall OEE Calculation
Using the example:
Availability: 90%
Performance: 95%
Quality: 98%
OEE:
90% × 95% × 98% = 83.79%
This provides a combined measure of how effectively the equipment converts planned production time into good-quality output.
For actual food processing operations, manufacturers should define planned production time, ideal production rates, output units, and quality-counting rules according to the process being monitored.
Key Features of Food Industry OEE Software
An effective OEE monitoring solution should help food manufacturers collect reliable production information and identify operational losses.
1. Real-Time Machine Status Monitoring
Machine status monitoring provides visibility into whether processing and packaging equipment is running, stopped, or in another configured state.
Production managers can use a centralised dashboard to identify interruptions and understand which machines require attention.
This can be especially useful in facilities where several machines operate simultaneously across different production areas.
2. Automated Production Counting
Accurate production counting helps manufacturers compare actual output with production targets.
Depending on available machine signals, monitoring software can collect production information through PLCs, controller interfaces, sensors, or other supported methods.
The production unit should reflect the actual process.
Examples include:
Individual packaged products
Bottles or containers filled
Kilograms of processed material
Litres of finished product
Completed production batches
Automated data collection can reduce manual recording errors and provide more consistent production reports.
3. Downtime Tracking and Analysis
Downtime tracking helps manufacturers identify when equipment stops and how much production time is lost.
Food processing facilities can configure downtime categories based on their operations.
Common examples include:
Equipment breakdown
Material shortage
Processing-line blockage
Filling or packaging machine stoppage
Changeover and setup
Cleaning and sanitation
Maintenance activity
Quality inspection
Utility-related interruption
Analysing downtime by category helps production and maintenance teams identify recurring problems and prioritise corrective actions.
4. Production Rate Monitoring
Production rate monitoring compares actual output against the expected production rate.
This helps identify machines that remain operational but produce below their expected capacity.
For example, a filling machine may continue running throughout a shift but operate at a lower bottles-per-minute rate because of repeated minor interruptions.
Monitoring production speed helps managers investigate the reasons behind this performance gap.
5. Centralised Production Dashboard
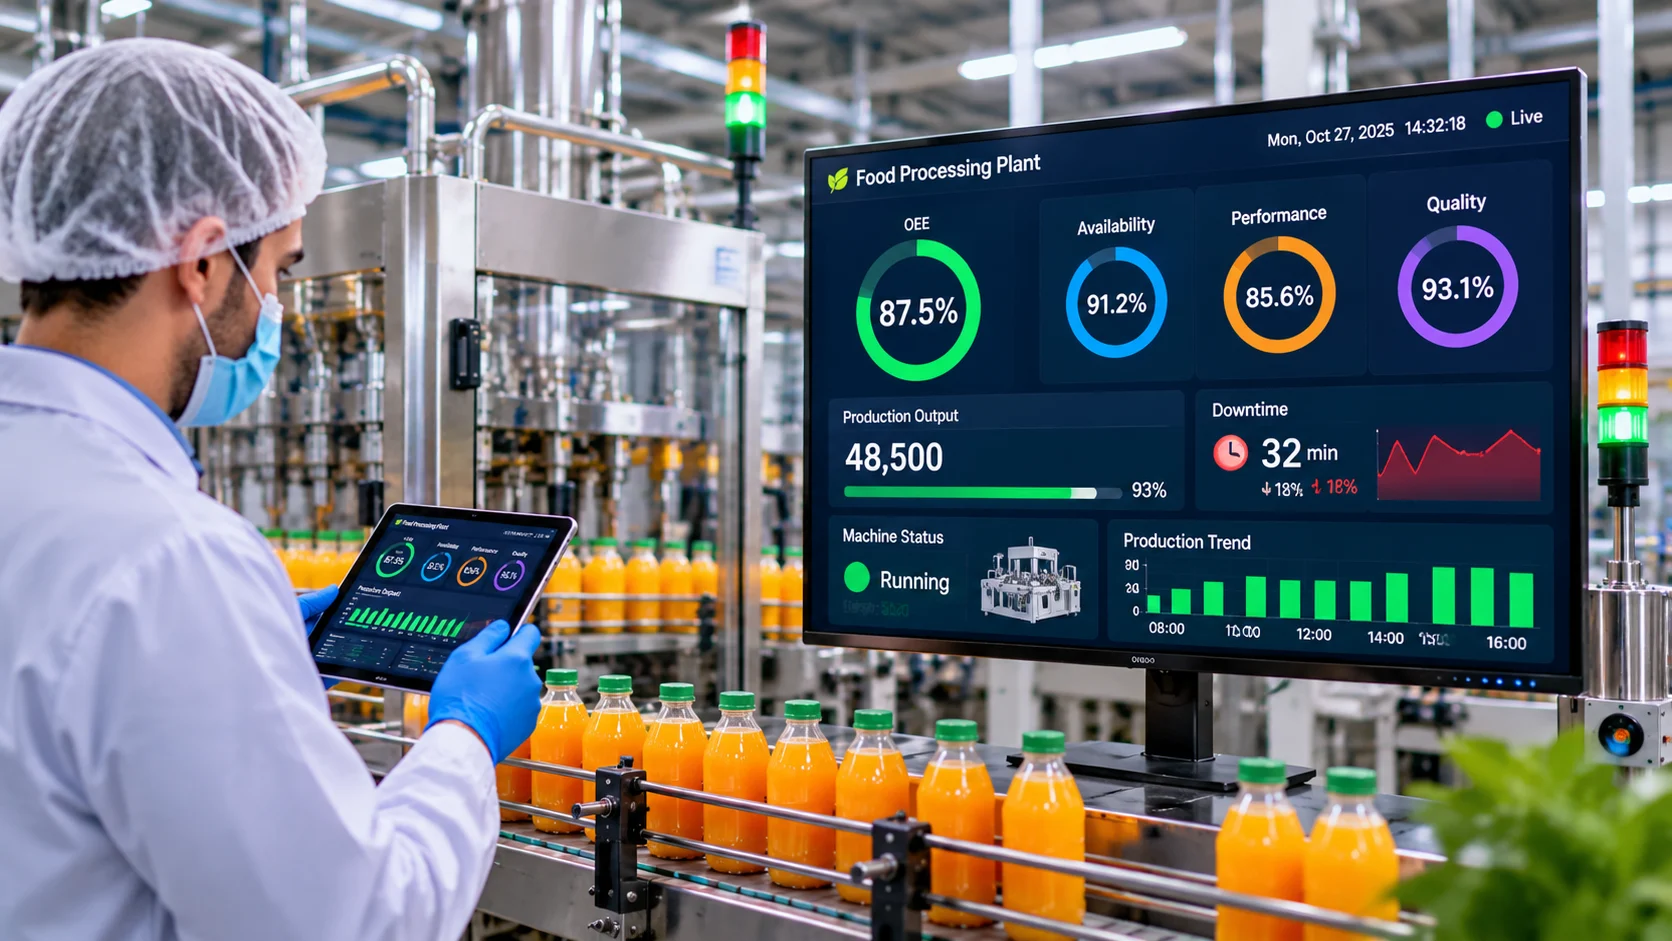
A centralised dashboard provides a consolidated view of machine and production-line performance.
Depending on the monitoring configuration, managers can review:
Availability percentage
Performance percentage
Quality percentage
Overall OEE
Total production output
Good and rejected units
Machine running status
Downtime duration
Shift-wise production performance
Production target achievement
This helps managers understand how different production lines are performing without depending entirely on separate reports.
Internal link opportunity: Link the anchor text Production Dashboard to the relevant Robato Systems product page in this section.
6. Shift-Wise Production Reports
Food processing plants may operate across multiple shifts with different product schedules and production requirements.
Shift-wise reports help managers compare output, downtime, and OEE across defined operating periods.
These reports also support shift handovers by providing a consistent record of production activity and interruptions.
7. Historical Production Analytics
Historical data helps manufacturers identify recurring problems and understand long-term performance trends.
Managers can analyse machine output, downtime reasons, production speed, and OEE over selected periods.
This information can support maintenance planning, production scheduling, and continuous improvement activities.
How OEE Monitoring Improves Food Manufacturing Efficiency
OEE monitoring creates value when production teams use the collected information to identify losses and implement practical improvements.
Reduce Unplanned Equipment Downtime
Unexpected machine stoppages reduce available production time and can affect connected production processes.
By reviewing downtime frequency, duration, and reason categories, managers can identify recurring problems and prioritise maintenance activities.
For example, repeated interruptions in a filling machine may require investigation into sensors, product feeding, equipment condition, or process settings.
Improve Production Throughput
Comparing actual output against expected production rates helps identify equipment that is operating below its reference capacity.
Production teams can investigate process conditions, machine settings, material flow, and other factors affecting output.
Any process adjustments should be validated against product specifications and applicable quality and safety requirements.
Improve Changeover and Cleaning Visibility
Changeover and cleaning activities can consume significant scheduled time.
Recording these activities separately helps managers understand their impact on production schedules and identify opportunities to improve preparation, coordination, and equipment availability.
The objective is to improve planning and reduce avoidable delays without compromising hygiene or sanitation requirements.
Reduce Quality-Related Production Losses
Tracking rejected products alongside total production provides a clearer view of quality performance.
Managers can investigate whether recurring losses are associated with specific machines, product batches, packaging formats, or production conditions.
This information supports better coordination between production and quality teams.
Improve Production Planning
Reliable machine-level information helps planners understand actual production capacity and historical output.
This can support more realistic scheduling, better allocation of production lines, and improved estimates of order completion times.
It can also help identify whether production delays are related to equipment, materials, or process constraints.
Improve Coordination Between Production Teams
Food processing operations often involve production, maintenance, quality, packaging, and material-handling teams.
Shared production information helps these teams work with a consistent view of machine performance and operational losses.
This can make production reviews more objective and help teams coordinate corrective actions.
Implementing OEE Monitoring in a Food Processing Plant
Successful implementation requires an understanding of the production process, machine connectivity, and the information required by different users.
Step 1: Map the Production Process
Start by documenting the equipment and production stages that need to be monitored.
For example:
Raw material handling
Mixing or blending
Processing or cooking
Filling and dosing
Sealing and packaging
Labelling and inspection
Finished-product handling
Identify production-counting points, machine signals, and potential bottlenecks at each stage.
Step 2: Define OEE Calculation Rules
Establish consistent rules for measuring equipment effectiveness.
Define:
Planned production time
Shift schedules
Ideal production rates
Production units
Total output
Good and rejected output
Downtime categories
Planned stoppage treatment
Different food products and processes may require different reference rates and production units.
Step 3: Connect Equipment to the Monitoring System
Machine data can be collected through supported controller interfaces, PLC signals, sensors, or suitable external monitoring arrangements.
The appropriate approach depends on the equipment manufacturer, controller, machine age, and available signals.
For older equipment, external sensing may be considered when direct machine integration is unavailable.
All signals should be validated to ensure that machine status and production counts are recorded correctly.
Step 4: Configure Machine-Level and Line-Level Dashboards
Configure dashboards based on the requirements of operators, supervisors, and plant managers.
Operators may need machine status and production counts, while supervisors may need downtime details and shift reports.
Plant managers may require a consolidated view of production performance across multiple lines.
Step 5: Train Operators and Supervisors
Production teams should understand how machine states are recorded, how downtime reasons are selected, and how output and quality data are interpreted.
Training helps improve consistency across shifts and makes production reports more reliable.
Step 6: Validate and Expand the System
Start with one production line or a selected group of machines.
Validate machine status, production counts, downtime records, and OEE calculations against actual operating conditions.
After successful validation, expand the monitoring system to additional production lines and production areas.
Common Challenges in Food Industry OEE Monitoring
Manufacturers should address several practical challenges to ensure that OEE data accurately represents production performance.
Different Products Require Different Production Rates
Food processing facilities may manufacture multiple products using the same equipment.
Different recipes, product sizes, packaging formats, and processing requirements can affect ideal production rates.
Using one reference rate for every product can distort performance calculations.
Maintain approved reference rates for relevant products and production configurations.
Inconsistent Production Units
Different stages of a food manufacturing process may measure output in kilograms, litres, batches, bottles, or packaged units.
These values should not be compared directly without defining the production flow and measurement rules.
Establish consistent production units for each monitored process.
Incorrect Downtime Classification
If all machine stoppages are recorded under one general category, managers cannot identify the main reasons behind production losses.
Create practical downtime categories and train operators to use them consistently.
Planned Cleaning and Sanitation Activities
Food manufacturing requires cleaning and sanitation procedures that must be handled according to applicable hygiene and safety requirements.
If planned cleaning activities are not classified consistently, OEE comparisons may become misleading.
Define how scheduled cleaning, changeovers, and unplanned cleaning interruptions will be treated in the OEE model.
Incomplete Quality Data
If rejected products and rework are not recorded accurately, the quality component of OEE may not reflect actual production conditions.
Define how good output, rejected products, and reworked units are counted and coordinate the process with the quality team.
Collecting Data Without Taking Action
A monitoring dashboard does not improve production by itself.
Managers should review major losses regularly, assign corrective actions, and measure whether those actions have improved machine and production-line performance.
How to Choose the Right Food Industry OEE Software
Selecting the right OEE solution requires evaluating the technical and operational requirements of the food processing facility.
Consider the following factors:
Machine compatibility: Check whether the software can connect with existing processing, filling, packaging, and inspection equipment.
Real-time monitoring: Confirm that machine status and production information are updated at a frequency suitable for operational decisions.
Automated production counting: Evaluate whether the system can capture output in the required units, including pieces, kilograms, litres, and batches.
Downtime analysis: Check whether machine stoppages can be categorised and analysed by frequency and duration.
Production rate tracking: Ensure that actual output can be compared with product-specific reference rates.
Quality tracking: Review how the system handles good products, rejected output, and rework.
Centralised dashboards: Confirm that managers can monitor individual machines and complete production lines.
Reporting capabilities: Evaluate support for shift-wise, machine-wise, and historical production reports.
Integration options: Consider requirements for connecting PLCs, ERP, MES, quality systems, or other manufacturing applications.
Scalability: Ensure that the solution can support additional production lines and manufacturing locations.
Implementation support: Understand the available assistance for machine connectivity, configuration, training, and ongoing technical support.
The right solution should fit the factory's production environment and provide reliable information that teams can use to improve operations.
Measuring the ROI of Food Industry OEE Software
The return on investment from food industry OEE software depends on how effectively manufacturers use production data to reduce losses and improve output.
Potential benefits include:
Reduced avoidable equipment downtime
Improved production-line throughput
Better machine utilisation
Reduced quality-related losses
Improved changeover visibility
More accurate production planning
Better coordination between production and maintenance teams
For example, suppose a food processing line has 480 minutes of planned production time per shift. Monitoring data identifies recurring interruptions that account for 25 minutes of lost operating time.
If corrective actions recover a portion of this time and the facility has sufficient demand and downstream capacity, the additional good-quality output can be used to estimate the potential financial benefit.
A realistic ROI assessment should also consider software costs, hardware, integration, training, maintenance, and the operational resources required to sustain improvements.
Recovered machine time should not automatically be treated as additional revenue. Actual financial benefits depend on material availability, production demand, downstream capacity, and product quality requirements.
Building a Continuous Improvement Process With OEE Data
OEE monitoring should become part of the regular production improvement process across the food manufacturing facility.
Manufacturers can follow four practical stages:
Measure: Collect reliable machine-status, production-count, downtime, and quality information.
Analyse: Identify the biggest production losses and investigate their underlying causes.
Improve: Implement corrective actions related to equipment, maintenance, production settings, material flow, or operating procedures.
Verify: Compare performance before and after the changes to determine whether improvements are sustained.
Regular performance reviews help plant managers focus on measurable production problems and coordinate improvement activities across different teams.
Over time, this approach can improve production visibility, support better planning, and help manufacturers make more effective use of their existing equipment.
Conclusion
Food processing plants depend on reliable equipment, consistent production rates, product quality, and coordinated operations. When machines experience repeated stoppages or operate below their expected capacity, the impact can affect production schedules, costs, and delivery commitments.
Food Industry OEE Software helps manufacturers measure availability, performance, and quality while providing visibility into equipment downtime, production output, and quality-related losses.
With accurate data collection and a structured improvement process, food plant managers can identify recurring problems, prioritise corrective actions, and make more informed production decisions.
Robato Systems provides production monitoring solutions designed to improve shop-floor visibility and support data-driven manufacturing operations.
Want better visibility into your food processing operations? Contact Robato Systems to discuss your production monitoring requirements.