Real-Time Weighbridge Dashboard for Enterprise Visibility
Introduction
Industrial businesses generate thousands of weighbridge transactions every day. From raw material receipts and finished goods dispatches to vehicle movement and inventory updates, every transaction produces valuable operational data. However, if this information is scattered across reports, spreadsheets, or disconnected systems, management teams struggle to gain meaningful insights and make timely decisions.
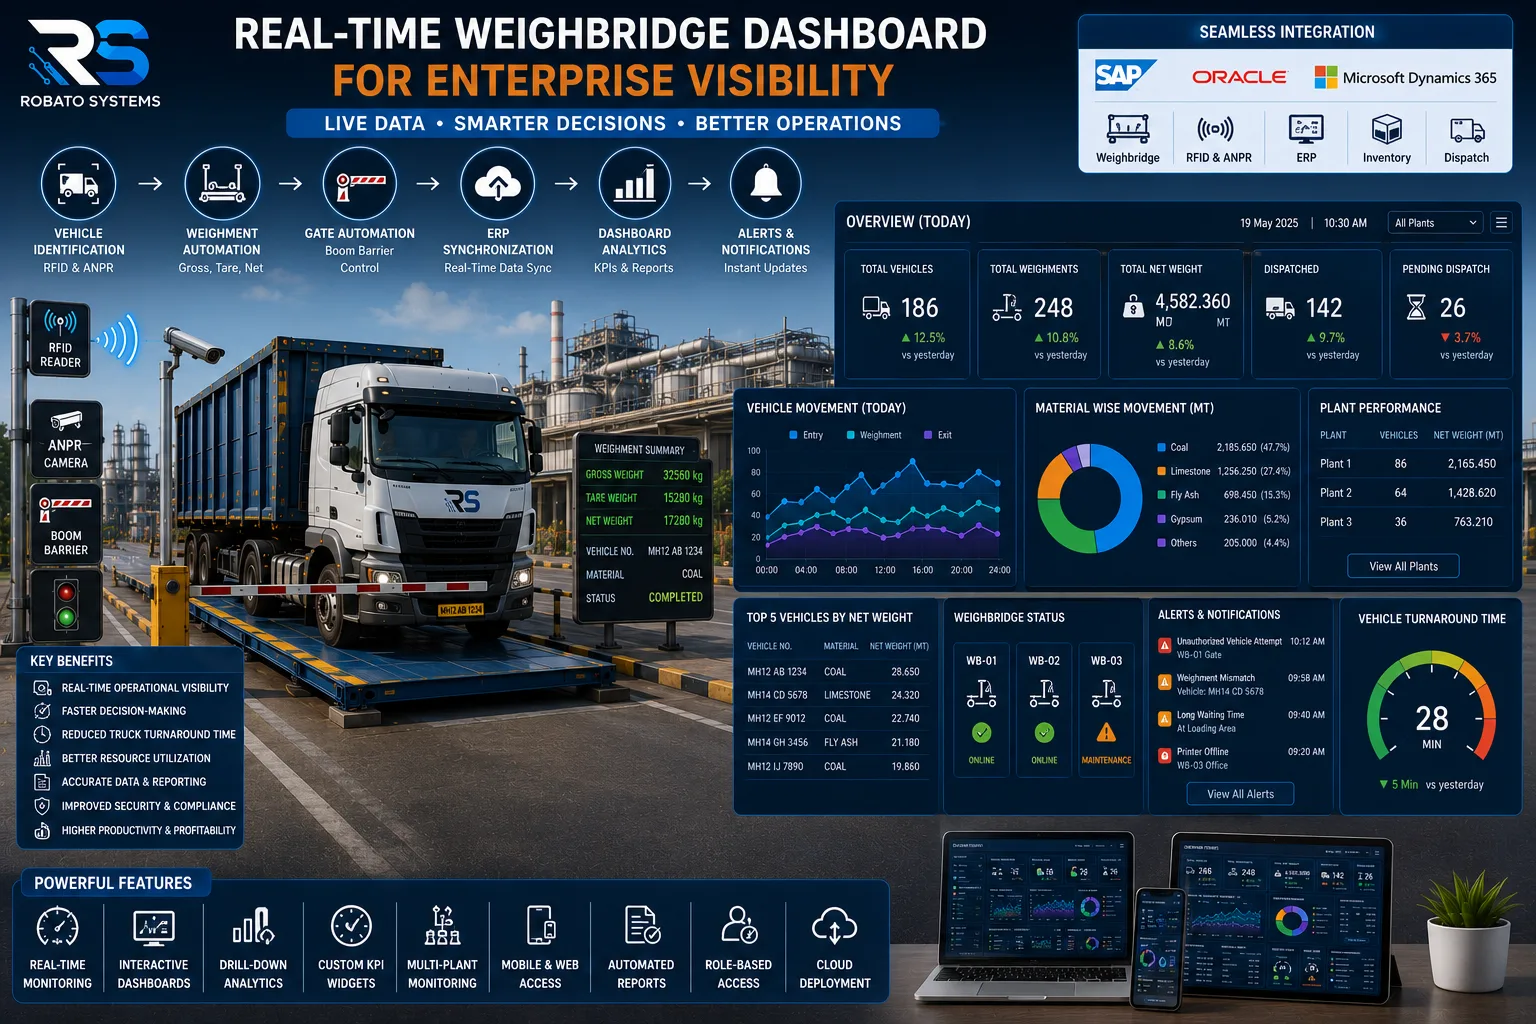
Weighbridge Dashboard Software brings all critical weighbridge information into a single, centralized dashboard. It provides real-time visibility into vehicle movement, weighment activities, dispatch operations, inventory flow, and operational performance through interactive charts, graphs, and Key Performance Indicators (KPIs).
Whether managing a single manufacturing facility or multiple industrial locations, a real-time dashboard enables decision-makers to monitor operations instantly, identify bottlenecks, and improve overall business efficiency.
What is Weighbridge Dashboard Software?
Weighbridge Dashboard Software is a centralized monitoring and analytics platform that displays live operational data collected from weighbridge automation systems.
Instead of reviewing multiple reports, users can view all important metrics from one interactive dashboard, allowing faster analysis and better decision-making.
The dashboard collects information from various integrated systems, including:
RFID Vehicle Identification
ANPR Cameras
Boom Barrier Systems
ERP Software
Inventory Management Systems
Cloud-Based Monitoring Platforms
This creates a single source of truth for operational monitoring.
Why Businesses Need a Real-Time Weighbridge Dashboard
Modern industries operate in highly competitive environments where delays, inefficiencies, and inaccurate data directly impact profitability.
Without a centralized dashboard, businesses often face:
Limited Operational Visibility
Managers cannot monitor ongoing weighbridge activities in real time.
Delayed Decision-Making
Static reports provide historical information rather than live operational insights.
Difficulty Monitoring Multiple Locations
Managing several weighbridges across different plants becomes challenging without centralized visibility.
Slow Response to Operational Issues
Equipment failures, long truck queues, or dispatch delays may go unnoticed.
Manual Performance Analysis
Compiling operational reports manually consumes valuable management time.
How Weighbridge Dashboard Software Works
Step 1: Data Collection
The software collects real-time information from weighbridges, RFID readers, ANPR cameras, ERP systems, and other connected devices.
Step 2: Data Processing
Incoming data is validated, categorized, and stored securely in a centralized database.
Step 3: Live Dashboard Updates
Interactive widgets automatically refresh to display the latest operational information.
Step 4: KPI Calculation
The software calculates key performance indicators using real-time operational data.
Step 5: Management Monitoring
Authorized users access dashboards through desktops, tablets, or mobile devices.
Step 6: Automated Alerts
The system notifies users about operational exceptions, delays, equipment issues, or unauthorized vehicle movement.
Key Features of Weighbridge Dashboard Software
Live Weighment Monitoring
Track all ongoing weighbridge transactions in real time.
Vehicle Movement Dashboard
Monitor vehicle entry, weighing, loading, dispatch, and exit activities.
Interactive Charts & Graphs
Visualize operational trends through dynamic charts and graphical reports.
Multi-Plant Monitoring
View operational data from multiple facilities using one centralized dashboard.
Role-Based Dashboards
Provide customized dashboard views for plant managers, logistics teams, executives, and administrators.
ERP Integration
Synchronize operational data with ERP, inventory, finance, and procurement systems.
Custom KPI Widgets
Display business metrics that match organizational goals.
Cloud Accessibility
Securely access dashboards from any location using cloud connectivity.
Essential KPIs Every Weighbridge Dashboard Should Display
A modern weighbridge dashboard should provide visibility into the following metrics:
Total Vehicles Processed
Gross Weight
Net Weight
Material Received
Material Dispatched
Average Vehicle Turnaround Time
Daily Weighments
Pending Dispatches
Equipment Status
Boom Barrier Activity
RFID Detection Success Rate
ANPR Recognition Accuracy
Operator Productivity
Peak Traffic Hours
Multi-Plant Performance Comparison
These KPIs enable management teams to identify trends and optimize operations.
Benefits of Weighbridge Dashboard Software
Complete Operational Visibility
Monitor every stage of weighbridge operations from one centralized platform.
Faster Decision-Making
Real-time insights enable immediate responses to operational issues.
Improved Productivity
Reduce manual reporting and improve management efficiency.
Better Resource Utilization
Identify bottlenecks and optimize manpower and equipment usage.
Enhanced Business Intelligence
Analyze historical and real-time operational trends for strategic planning.
Multi-Site Management
Manage multiple industrial locations without switching between systems.
Improved Compliance
Maintain accurate digital records for audits and regulatory reporting.
Data-Driven Management
Support informed decisions using real-time operational analytics.
Industries That Benefit from Weighbridge Dashboard Software
Manufacturing Plants
Track production logistics and material movement.
Cement Industry
Monitor dispatch operations and vehicle turnaround time.
Mining Operations
Visualize mineral transportation and fleet utilization.
Steel Manufacturing
Track inbound raw materials and outbound finished products.
Logistics Companies
Manage fleet movement and dispatch performance.
Warehousing & Distribution
Monitor warehouse vehicle activity and inventory movement.
Power Plants
Track coal handling and transportation operations.
Best Practices for Dashboard Implementation
To maximize the value of dashboard software:
Integrate all weighbridge devices into one platform.
Define business-specific KPIs.
Enable cloud-based access for remote monitoring.
Configure automated alerts for operational exceptions.
Provide role-based dashboard permissions.
Review dashboard metrics regularly.
Continuously optimize dashboards based on operational needs.
Future Trends in Weighbridge Dashboards
Artificial Intelligence
AI-powered dashboards will automatically identify operational inefficiencies and recommend improvements.
Predictive Analytics
Businesses will forecast vehicle arrivals, dispatch demand, and equipment utilization.
Internet of Things (IoT)
Connected sensors will continuously update dashboards with live equipment and vehicle information.
Business Intelligence Integration
Weighbridge dashboards will integrate with enterprise BI platforms such as Microsoft Power BI and Tableau for advanced analytics.
Digital Twins
Future dashboards will simulate complete logistics operations to improve planning and resource allocation.
Why Choose a Centralized Weighbridge Dashboard?
A centralized dashboard enables organizations to move beyond simple transaction recording and embrace intelligent operational management.
By integrating weighbridge software with RFID systems, ANPR cameras, ERP platforms, dispatch management, and reporting tools, businesses gain complete visibility into logistics operations while improving decision-making and operational efficiency.
Organizations using centralized dashboard software typically experience:
Faster truck turnaround
Better operational transparency
Improved management reporting
Increased productivity
Reduced operational costs
Higher customer satisfaction
Improved audit readiness
Conclusion
In today's data-driven industrial environment, visibility is essential for operational excellence. Weighbridge Dashboard Software provides organizations with real-time access to critical weighbridge data, enabling faster decisions, improved productivity, and greater operational control.
Whether operating one facility or managing multiple industrial plants, a centralized dashboard empowers management teams with live analytics, KPI tracking, and enterprise-wide visibility. As businesses continue investing in automation and digital transformation, implementing a modern weighbridge dashboard has become a strategic necessity for sustainable growth.
Frequently Asked Questions (FAQs)
What is Weighbridge Dashboard Software?
Weighbridge Dashboard Software is a centralized platform that displays real-time weighbridge data, vehicle movement, analytics, and operational KPIs through interactive dashboards.
Can the dashboard monitor multiple weighbridges?
Yes. Modern dashboard software supports centralized monitoring of multiple weighbridges and industrial facilities from a single interface.
Does dashboard software integrate with ERP systems?
Yes. It integrates with ERP platforms such as SAP, Oracle, Microsoft Dynamics, and other enterprise applications.
Which industries benefit from weighbridge dashboards?
Manufacturing, mining, cement, steel, logistics, warehousing, power generation, and chemical industries all benefit from real-time dashboard monitoring.
What are the main benefits of a weighbridge dashboard?
The major benefits include real-time monitoring, KPI visualization, improved operational visibility, faster decision-making, and better business intelligence.