Real-Time OEE Dashboard for Multi-Line Manufacturing Plants
Managing production across multiple manufacturing lines becomes increasingly difficult when production data is scattered across machines, operators, spreadsheets and separate monitoring systems. Plant managers and operations teams need more than end-of-shift reports to understand what is happening on the shop floor.
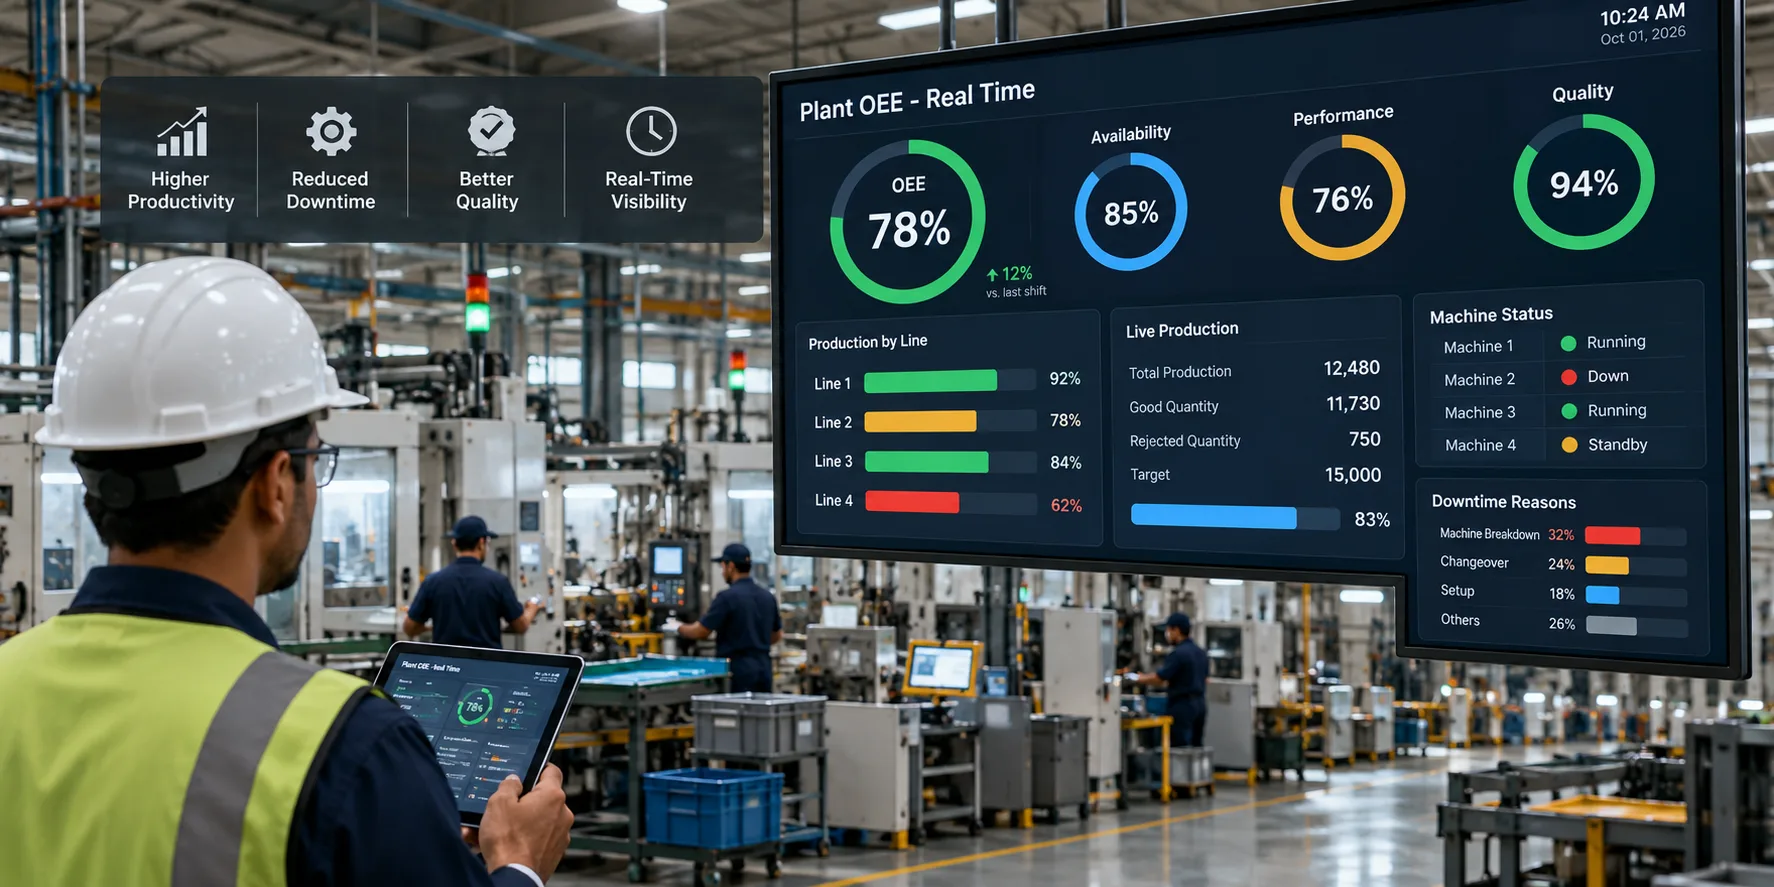
A Real Time OEE Dashboard provides a centralized view of production performance by bringing machine and production data together in a live manufacturing dashboard. Instead of waiting for manual reports, teams can monitor key production indicators as operations are taking place.
For multi-line manufacturing plants, this visibility can help production teams identify downtime, understand performance losses, monitor quality and respond to production issues faster.
What Is a Real-Time OEE Dashboard?
A real-time OEE dashboard is a manufacturing performance monitoring interface that displays production data as it is generated.
OEE, or Overall Equipment Effectiveness , is commonly calculated using three core factors:
OEE = Availability × Performance × Quality
These three measurements provide a structured way to understand how effectively equipment is being utilized.
A real-time dashboard can bring these metrics together with additional production information such as:
Machine running status
Planned and unplanned downtime
Production quantity
Target production
Good and rejected quantities
Cycle time
Availability
Performance
Quality
OEE percentage
Production losses
Shift-wise performance
The result is a more connected view of manufacturing performance instead of relying entirely on manually prepared production reports.
Why Multi-Line Plants Need Real-Time Production Visibility
A single production line may be relatively easy to monitor manually. However, as the number of machines and production lines increases, identifying problems becomes more challenging.
Consider a plant operating several production lines simultaneously. One line may be running below its expected cycle time, another may be experiencing repeated downtime, while a third may have increased rejection rates.
If this information is only reviewed at the end of a shift, valuable production time may already have been lost.
A live production dashboard gives production and operations teams an opportunity to see these changes while production is still underway.
This allows teams to move from:
"What happened during the shift?"
to:
"What is happening on the shop floor right now?"
That difference is particularly important for plants where production targets, machine utilization and downtime directly affect output.
How a Real-Time OEE Dashboard Works
A real-time OEE monitoring setup typically collects production information from machines, PLCs, sensors, production counters or other connected systems.
The information can then be processed and presented through a centralized dashboard.
A typical workflow looks like this:
Machine Data → Data Collection → Production Processing → OEE Calculation → Real-Time Dashboard → Production Action
The dashboard can continuously update production indicators so that authorized users can monitor the status of different machines and production lines.
Depending on the manufacturing environment, the system may also integrate with existing automation and business systems.
Key Metrics to Monitor on an OEE Dashboard
An effective manufacturing dashboard should provide more than a single OEE percentage. Operations teams need enough context to understand why performance is changing.
1. Availability
Availability indicates how much of the planned production time equipment was actually available for production.
Monitoring availability can help teams identify:
Machine breakdowns
Unplanned stoppages
Setup time
Changeover losses
Waiting time
Other downtime events
This makes it easier to understand whether lost production time is related to equipment availability.
2. Performance
Performance measures how efficiently equipment is producing compared with its expected operating speed.
A machine may be technically running but still producing below its expected rate.
A real-time dashboard can help identify situations such as:
Reduced machine speed
Longer cycle times
Minor stoppages
Slow production rates
Production below target
This provides greater visibility into losses that may otherwise remain hidden.
3. Quality
Quality tracks the proportion of production that meets the required quality standard.
The dashboard can show:
Total production
Good production
Rejected production
Rejection percentage
Quality-related losses
Monitoring these indicators alongside availability and performance helps teams understand the overall production effectiveness of each line.
4. OEE
OEE combines availability, performance and quality into one performance indicator.
However, the value of OEE comes from understanding the factors behind the number.
For example, if one production line has lower OEE than another, managers can investigate whether the difference is caused by downtime, slower production or quality losses.
Managing Multiple Production Lines from One Dashboard
One of the biggest advantages of a Real Time OEE Dashboard is centralized visibility.
Instead of checking individual machines or separate reports, plant teams can view multiple production lines from a common interface.
The exact metrics and dashboard design can vary according to the plant's production process.
The important point is that decision-makers can quickly identify where attention may be required.
Real-Time Downtime Monitoring
Downtime is one of the most important areas to monitor in manufacturing operations.
A machine can lose production time because of equipment failure, material shortages, changeovers, maintenance activities, operator availability or other operational conditions.
A real-time OEE dashboard can make downtime more visible by showing machine status and downtime information as production progresses.
Instead of discovering after the shift that a machine was unavailable for a significant period, the production team can identify the event closer to when it occurs.
This can support faster investigation and corrective action.
Compare Performance Across Production Lines
Multi-line manufacturing environments often have machines performing the same or similar operations.
Comparing their performance can reveal differences that may not be obvious from individual machine reports.
For example, production teams may compare:
OEE by production line
Availability by machine
Performance by shift
Production against target
Downtime by reason
Rejection rates
Actual cycle time versus standard cycle time
These comparisons can help continuous improvement teams identify areas that require further investigation.
Shift-Wise Production Monitoring
Production performance can vary significantly between shifts.
A real-time manufacturing dashboard can provide shift-level visibility into production output and machine performance.
Managers can review information such as:
Shift production
Target versus actual output
OEE by shift
Downtime by shift
Quality losses
Machine utilization
Production losses
This creates a more consistent basis for reviewing operational performance.
It also reduces dependence on manually consolidated shift reports.
Benefits of a Real-Time OEE Dashboard
Implementing real-time OEE monitoring can provide several operational benefits for manufacturing organizations.
Faster Identification of Production Issues
Live production information allows teams to identify abnormal conditions sooner instead of waiting for periodic reports.
Better Machine Visibility
Production managers can view the operational status of multiple machines and lines from a centralized dashboard.
Improved Production Monitoring
Real-time production data makes it easier to compare actual output against production targets during the shift.
More Structured Downtime Analysis
Capturing downtime information provides a stronger foundation for investigating production losses.
Better Decision-Making
Instead of relying primarily on manually prepared reports, managers can use current production information when reviewing operational conditions.
Improved Continuous Improvement
Historical OEE and production data can help continuous improvement teams identify recurring performance patterns and areas for investigation.
What Should You Look for in a Real-Time OEE Dashboard?
Choosing an OEE dashboard should not be based only on how many charts or visual elements it contains. The system should support the actual requirements of the manufacturing operation.
Important capabilities may include:
Real-time machine status
Multi-line monitoring
OEE calculation
Availability, performance and quality tracking
Production target monitoring
Downtime monitoring
Shift-wise analysis
Historical production data
Production reports
Role-based access
Dashboard visualization
Integration with existing machine data sources
The right configuration will depend on the plant's machinery, production processes, automation infrastructure and reporting requirements.
Connecting an OEE Dashboard with Existing Manufacturing Systems
Manufacturing plants rarely operate with completely isolated systems. Existing infrastructure may include PLCs, machine controllers, sensors, ERP systems, production databases and other applications.
A real-time OEE solution should therefore be capable of working with the plant's existing technology environment where required.
Depending on the implementation, production information may be collected through machine interfaces, PLC communication, sensors, APIs or other available data sources.
This approach can allow organizations to introduce better production visibility without necessarily replacing their existing manufacturing infrastructure.
Real-Time Dashboard vs. Traditional Production Reporting
Traditional production reporting is often based on information collected and consolidated after production activities have taken place.
A real-time OEE dashboard focuses on visibility during production.
Traditional ReportingReal-Time OEE DashboardOften reviewed after productionMonitored during productionGreater reliance on manual data collectionAutomated or connected data collectionLimited live visibilityLive production visibilityIssues may be identified laterIssues can be identified closer to occurrenceReports focused on historical performanceCurrent and historical performanceDifficult to compare multiple lines quicklyCentralized multi-line monitoring
Traditional reports still have value for analysis and documentation. However, real-time monitoring can add another layer of operational visibility for teams responsible for daily production performance.
How an OEE Dashboard Supports Continuous Improvement
OEE should not be treated simply as a number displayed on a screen.
Its real value comes from using production data to understand losses and investigate improvement opportunities.
For example, if a production line repeatedly experiences short stoppages, the operations team can investigate the underlying causes.
Similarly, if one machine consistently operates below its expected performance rate, production engineers can examine cycle times, machine settings, material conditions or other relevant factors.
Over time, this creates a structured feedback loop:
Measure → Identify Loss → Investigate Cause → Take Action → Measure Again
A real-time dashboard can provide the measurement and visibility required to support this continuous improvement process.
Who Uses a Real-Time OEE Dashboard?
Different teams can use OEE dashboards for different operational purposes.
Plant Managers can monitor overall production performance across the facility.
Production Managers can track machine and line performance during active production.
Operations Managers can compare production performance and identify areas requiring attention.
Maintenance Teams can use machine and downtime information to support equipment-related investigations.
Continuous Improvement Teams can analyze recurring production losses and performance patterns.
Plant Directors and Leadership Teams can use summarized KPIs to understand manufacturing performance at a higher level.
The dashboard therefore becomes a shared source of production information for different levels of the organization.
Final Thoughts
For multi-line manufacturing plants, production visibility becomes increasingly important as the number of machines, processes and production targets grows.
A Real Time OEE Dashboard can bring machine performance, production output, downtime, quality and OEE information into one centralized view.
Instead of depending exclusively on end-of-shift reports, manufacturing teams can access current production information and use it to identify issues, compare line performance and support continuous improvement.
For organizations looking to strengthen their production monitoring approach, integrating real-time OEE visibility with existing manufacturing operations can be an important step toward more data-driven decision-making.
Explore your Production Dashboard capabilities to understand how centralized production visibility can support your manufacturing operations.
Ready to Improve Production Visibility?
If your plant operates multiple production lines and you want better visibility into machine performance, downtime and OEE, a real-time monitoring solution can help bring critical production information together.
Request a Demo to explore how real-time OEE monitoring can fit your manufacturing environment.