Introduction
Manufacturing plants often focus on production targets, output quantities, and delivery schedules. However, achieving planned production consistently requires more than monitoring the number of units manufactured. Machines may experience unexpected stoppages, operate below their ideal speed, or produce components that require rejection or rework. These issues create production losses that can remain unnoticed when manufacturers depend only on manual reports and end-of-shift summaries.
For continuous improvement teams, identifying these losses is the first step toward improving manufacturing performance. Without reliable production data, it becomes difficult to determine whether missed targets are caused by machine downtime, reduced operating speed, quality issues, or inefficient production processes.
Production Loss Analysis Software helps manufacturers understand where production capacity is being lost by using machine performance data and Overall Equipment Effectiveness (OEE) metrics. It provides a structured approach to measuring availability, performance, and quality, allowing teams to identify the operational factors affecting production output.
By connecting production monitoring with loss analysis, manufacturers can move beyond simply reporting missed targets and start investigating the reasons behind them.
What Is Production Loss Analysis in Manufacturing?
Production loss analysis is the process of identifying, measuring, and evaluating factors that prevent a manufacturing operation from achieving its planned production output.
These losses can occur at different stages of the production process. Some are related to machine availability, while others result from reduced production speed or defective products.
For example, consider a machine scheduled to operate for an eight-hour shift. During the shift, it may experience breakdowns, wait for raw materials, operate below its standard cycle time, and produce rejected components.
Although the machine was scheduled for eight hours, its actual productive output may be significantly lower than expected.
Production loss analysis helps manufacturing teams understand:
How much planned production time was lost.
Which machines experienced the most downtime.
Where actual production speed fell below the ideal rate.
How many units were rejected or required rework.
Which production processes repeatedly missed their targets.
Whether corrective actions improved performance.
The purpose is to convert production data into actionable information that supports continuous improvement.
Understanding the Three Major Production Loss Categories Through OEE
Overall Equipment Effectiveness provides a standardized framework for understanding equipment-related production losses.
OEE is calculated using three components:
OEE = Availability × Performance × Quality
Each component represents a different aspect of production effectiveness.
1. Availability Losses
Availability measures the proportion of planned production time during which a machine is actually operating.
Availability losses occur when equipment is unavailable during planned production time.
Common examples include:
Unexpected machine breakdowns.
Electrical or mechanical failures.
Tooling and equipment changeovers.
Extended setup activities.
Material shortages.
Unplanned maintenance interruptions.
For example, if a machine is scheduled to operate for 480 minutes but experiences 60 minutes of downtime, its operating time is 420 minutes.
Availability is calculated as:
Availability = Operating Time ÷ Planned Production Time × 100
In this example:
420 ÷ 480 × 100 = 87.5%
This indicates that 12.5% of planned production time was lost to downtime under the defined calculation rules.
2. Performance Losses
Performance measures how efficiently a machine operates compared with its ideal production speed.
A machine may remain switched on and running but still produce fewer units than expected because of slow cycle times, minor stoppages, reduced operating speeds, or process limitations.
Common performance losses include:
Frequent short-duration stoppages.
Slower-than-standard machine cycles.
Reduced operating speed.
Material feeding delays.
Operator-related process interruptions.
Inefficient machine settings.
Performance is calculated as:
Performance = Ideal Cycle Time × Total Production Count ÷ Operating Time × 100
For example, if the ideal cycle time is 1 minute per unit, a machine operating for 420 minutes should theoretically produce 420 units.
If it produces only 378 units, its performance is:
378 ÷ 420 × 100 = 90%
This indicates that the machine operated below its ideal production rate.
3. Quality Losses
Quality measures the proportion of total produced units that meet the required quality standards.
Quality losses occur when products are rejected, defective, or require rework according to the manufacturer's defined quality criteria.
Common examples include:
Incorrect machine settings.
Dimensional inaccuracies.
Surface defects.
Material-related defects.
Assembly errors.
Process inconsistencies.
Rejected components during inspection.
Quality is calculated as:
Quality = Good Production Count ÷ Total Production Count × 100
For example, if a machine produces 378 units and 370 meet the required quality standards:
370 ÷ 378 × 100 = 97.88%
The remaining units represent quality-related production losses.
How Production Loss Analysis Software Helps Manufacturers
Manual production reports can show that a target was missed, but they may not explain where the loss occurred or how frequently it happens.
Production loss analysis software combines production information and OEE metrics to provide a clearer understanding of machine performance.
1. Identify Machine Downtime
Machine downtime is one of the most visible causes of production loss.
However, simply recording total downtime does not always explain the underlying problem.
A machine may stop because of mechanical breakdowns, electrical faults, material shortages, tooling issues, or planned changeovers.
A production monitoring system can capture machine running and stopped conditions through supported PLCs, sensors, controllers, or other configured data sources.
This helps teams review:
Total downtime duration.
Number of stoppage events.
Machine-wise downtime.
Shift-wise downtime.
Recurring stoppage patterns.
Downtime categories and reasons, where recorded.
Internal link placement: Add an internal link on the anchor text Downtime Monitoring to the Robato Systems Downtime Monitoring page in this section.
2. Detect Performance Losses
A machine can remain operational while producing fewer units than its expected capacity.
This type of loss may be difficult to identify through basic machine status monitoring because the equipment is technically running.
By comparing actual production counts with ideal cycle time, teams can evaluate whether machines are operating at their expected speed.
For example, if a CNC machine should complete a component in 45 seconds but consistently takes 55 seconds, the difference may indicate an opportunity to investigate tooling condition, machine settings, material characteristics, or process limitations.
3. Monitor Quality-Related Production Losses
Production quantity alone does not represent effective manufacturing output.
A machine may achieve its production target but still create significant losses if a high proportion of components fail inspection.
Production loss analysis can incorporate good and rejected production quantities to calculate the quality component of OEE.
This helps continuous improvement teams evaluate whether process changes are affecting both production speed and product quality.
4. Compare Planned and Actual Production
Production targets provide a reference point for evaluating manufacturing performance.
By comparing planned quantities with actual output, managers can identify production gaps across machines, lines, and shifts.
For example:
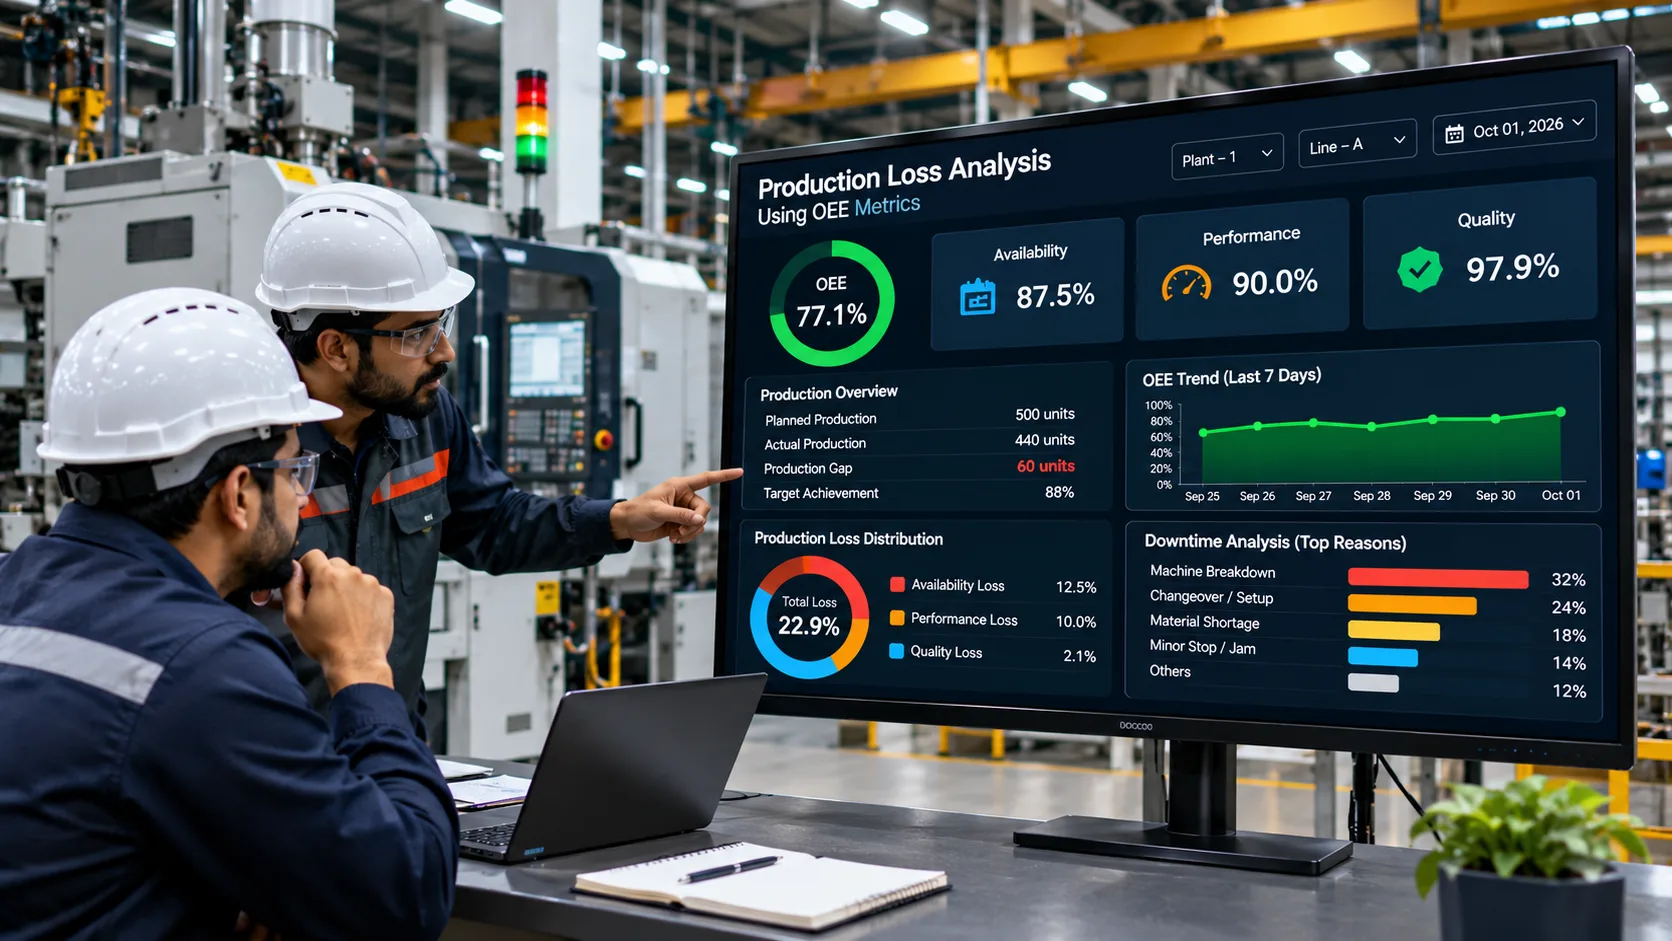
Production Parameter | Value |
|---|---|
Planned Production | 500 units |
Actual Production | 440 units |
Production Gap | 60 units |
Target Achievement | 88% |
This comparison identifies the output gap, while OEE and supporting production records help investigate the underlying causes.
5. Analyze Historical Production Losses
A single production report may reveal an isolated issue, but historical data can help identify recurring operational problems.
For example, a manufacturing plant may observe that a particular machine experiences frequent downtime during the second shift or that a specific production line consistently operates below its expected cycle time.
Historical analysis helps teams investigate these patterns and prioritize improvement activities.
Example: Production Loss Analysis Using OEE Metrics
Consider an automotive component manufacturing plant operating a machine for one eight-hour shift.
The production team wants to understand why actual output is lower than the planned production capacity.
The following example illustrates how OEE metrics can help identify the different categories of production loss.
Production Data
Parameter | Value |
|---|---|
Planned Production Time | 480 minutes |
Total Downtime | 60 minutes |
Operating Time | 420 minutes |
Ideal Cycle Time | 1 minute per unit |
Total Production | 378 units |
Good Production | 370 units |
Rejected Production | 8 units |
OEE Calculation
Step 1: Availability
420 ÷ 480 × 100 = 87.5%
Step 2: Performance
(1 × 378) ÷ 420 × 100 = 90%
Step 3: Quality
370 ÷ 378 × 100 = 97.88%
Step 4: Overall Equipment Effectiveness
87.5% × 90% × 97.88% = 77.08% approximately
<em>Note: The example assumes the full planned production time is included in the availability calculation and that the ideal cycle time and production counts use consistent units and product definitions.</em>
What Does This Data Tell the Production Team?
The calculated OEE score provides an overall performance indicator, but the individual components reveal where the losses are occurring.
Availability at 87.5%: Downtime reduced the time available for production.
Performance at 90%: The machine produced fewer units than its ideal output during operating time.
Quality at 97.88%: Eight units did not meet the defined good-production criteria.
This breakdown helps the continuous improvement team prioritize investigations instead of treating the entire production gap as a single problem.
Important Production Loss Reports for Continuous Improvement Teams
A useful production loss analysis system should help teams examine performance from different operational perspectives.
1. Machine-Wise Loss Report
A machine-wise report helps identify equipment with the highest downtime, lowest OEE, or largest performance gaps.
It allows maintenance and production teams to prioritize machines that require investigation.
2. Shift-Wise Production Loss Report
Shift-wise reporting helps compare equipment performance across different operating periods.
Managers can investigate differences in downtime, production output, cycle time, and quality between shifts.
3. Downtime Reason Analysis
Downtime reason analysis groups machine stoppages into categories such as breakdown, material shortage, setup, changeover, and maintenance.
The accuracy of this report depends on consistent reason classification and reliable event data.
4. Production Target Achievement Report
This report compares planned production quantities with actual production output.
It helps supervisors understand where production targets were missed and identify the machines or lines contributing to the gap.
5. OEE Trend Report
OEE trend reports help manufacturers evaluate performance over time.
Teams can compare daily, weekly, monthly, and shift-wise results to understand whether production improvement initiatives are having a measurable effect.
How to Reduce Manufacturing Losses Using OEE Data
Collecting production information is only the first step. The real value of production loss analysis comes from using the findings to take corrective action.
Step 1: Establish a Performance Baseline
Begin by collecting reliable machine performance data over a representative production period.
Calculate availability, performance, and quality for the selected machines or production lines.
This baseline helps teams understand current performance before introducing improvement activities.
Step 2: Identify the Largest Loss Categories
Review OEE components and supporting reports to identify the largest sources of production loss.
For example, a machine with low availability may require maintenance investigation, while a machine with low performance may need cycle-time analysis.
Prioritize losses according to their operational impact rather than focusing only on the lowest OEE score.
Step 3: Investigate Root Causes
Use machine data, downtime records, operator feedback, maintenance history, and production information to investigate the causes of recurring losses.
Tools such as Pareto analysis and the 5 Whys can help teams organize investigations and distinguish symptoms from underlying causes.
Step 4: Implement Corrective Actions
Depending on the findings, improvement activities may include:
Preventive maintenance improvements.
Tooling and fixture optimization.
Machine parameter adjustments.
Better material availability planning.
Setup and changeover improvements.
Operator training.
Process standardization.
Quality control improvements.
The selected action should address the identified cause rather than simply attempting to improve the reported OEE number.
Step 5: Measure the Results
After implementing corrective actions, compare the new production data with the established baseline.
Evaluate whether downtime decreased, machine performance improved, or fewer products were rejected.
This creates a measurable improvement cycle supported by actual manufacturing data.
Key Features to Look for in Production Loss Analysis Software
Before selecting a production loss analysis solution, manufacturers should evaluate whether it supports their equipment, production environment, and reporting requirements.
Important capabilities include:
Machine Data Collection: Ability to collect relevant machine status and production information through supported connectivity methods.
OEE Calculation: Automated availability, performance, and quality calculations based on clearly configured production parameters.
Downtime Tracking: Recording machine stoppages, duration, frequency, and categorized reasons.
Production Count Monitoring: Tracking actual production quantities and comparing them with planned targets.
Loss Categorization: Separating availability, performance, and quality losses for easier analysis.
Machine and Line-Level Reporting: Reviewing performance across individual machines, production lines, and manufacturing areas.
Shift-Wise Analysis: Comparing production performance across operating shifts.
Historical Trends: Reviewing past production information to identify recurring problems and evaluate improvement results.
Dashboard Visibility: Presenting relevant production KPIs in a centralized interface for authorized users.
Manufacturers should also verify how the software handles planned stops, product-specific cycle times, rejected quantities, and different operating schedules. These definitions directly affect the accuracy and comparability of OEE results.
Production Loss Analysis Software vs. Traditional Manual Reporting
Parameter | Manual Production Reporting | Production Loss Analysis Software |
|---|---|---|
Data Collection | Operator or supervisor entries | Connected or configured data collection |
Machine Status | Periodic manual updates | Machine status monitoring, where integrated |
Downtime Analysis | Depends on recorded entries | Structured downtime tracking and reporting |
Production Count | Manual or separately recorded | Automated or configured production count collection |
OEE Calculation | Manual calculation or spreadsheets | Configured OEE calculation |
Historical Analysis | Requires maintaining reports | Centralized historical data, depending on system configuration |
Performance Visibility | Often delayed | More timely production visibility |
Loss Identification | Depends on manual review | Easier comparison of OEE loss categories |
Manual reporting can remain useful for operational notes and contextual information. However, connected production monitoring can reduce dependence on manual data collection and provide more consistent information for performance analysis.
Why Continuous Improvement Teams Need Production Loss Visibility
Continuous improvement initiatives depend on accurate information about manufacturing performance.
Without reliable data, teams may spend considerable time investigating isolated incidents or implementing corrective actions without knowing whether they addressed the actual problem.
Production loss analysis provides a common measurement framework for production, maintenance, quality, and management teams.
It helps organizations:
Prioritize machines and processes requiring improvement.
Identify recurring downtime patterns.
Evaluate machine speed and cycle-time performance.
Understand quality-related production losses.
Compare results before and after corrective actions.
Establish measurable improvement targets.
Support data-driven production reviews.
For continuous improvement managers, this visibility helps connect day-to-day manufacturing problems with measurable operational outcomes.
Conclusion
Production losses affect manufacturing capacity in several ways. Machine breakdowns reduce availability, slow operating speeds create performance losses, and defective products reduce quality output.
Without structured analysis, these losses can remain hidden across production reports and machine records.
Production Loss Analysis Software uses OEE metrics to help manufacturers measure these losses, understand their causes, and prioritize improvement activities.
By combining machine monitoring, production count tracking, downtime analysis, and OEE reporting, manufacturing teams can build a clearer picture of equipment effectiveness.
For organizations focused on continuous improvement, the goal should be to use reliable production data to reduce recurring losses, improve operational consistency, and make better manufacturing decisions.
Improve Production Performance with Robato Systems
Robato Systems provides industrial production monitoring solutions designed to help manufacturers gain better visibility into machine performance and production operations.
If your team wants to monitor machine activity, understand downtime, and analyze production performance using structured OEE information, connect with Robato Systems to discuss your manufacturing requirements.
Request a Demo to explore how OEE monitoring can support your production loss analysis and continuous improvement initiatives.