Production Efficiency Software for Continuous Improvement Teams
Improving production efficiency is rarely about making one major change on the factory floor. In most manufacturing environments, improvement comes from identifying repeated losses, understanding their causes and systematically reducing them over time.
A machine may lose a few minutes because of minor stoppages. A production line may operate below its standard speed. Changeovers may take longer than expected. Quality losses may reduce usable output. Individually, these issues can appear small. Across multiple machines and shifts, however, they can have a significant impact on plant performance.
This is where production efficiency software can provide value.
By bringing production data, machine performance, downtime, quality and OEE metrics into a centralized system, manufacturing teams can move from manually collecting information to continuously analyzing operational performance.
For continuous improvement teams, the objective is not simply to create another dashboard. It is to create a reliable data foundation for identifying losses, prioritizing improvement opportunities and measuring whether corrective actions are actually working.
What Is Production Efficiency Software?
Production efficiency software is a manufacturing technology solution designed to help organizations measure, monitor and improve the performance of their production processes.
Depending on the manufacturing environment, the software can collect information from machines, PLCs, production counters, sensors and other operational systems.
The collected information can then be used to monitor metrics such as:
Production output
Production targets
Machine availability
Machine performance
Product quality
Downtime
Cycle time
Rejected quantity
Machine utilization
OEE
Production losses
Shift performance
Instead of keeping this information across spreadsheets, manual reports and disconnected systems, teams can use a centralized platform to analyze production performance.
Why Continuous Improvement Teams Need Better Production Data
Continuous improvement depends on understanding the current state of a process.
Without reliable production data, improvement discussions can become heavily dependent on assumptions, operator feedback or manually prepared reports.
These sources can still be valuable, but they may not provide enough detail to identify recurring performance losses.
For example, a production team may know that a particular machine is "underperforming."
The next questions are more important:
How often does the problem occur?
How much production time is being lost?
Is the issue related to downtime or reduced speed?
Does it happen on every shift?
Does it affect specific products?
Is the problem getting better or worse?
Did a recent improvement actually increase performance?
Production efficiency software can help provide the data required to investigate these questions.
How Production Efficiency Software Supports Continuous Improvement
A continuous improvement program typically follows a cycle:
Measure → Analyze → Identify → Improve → Verify
Production efficiency software can support each stage.
Measure
The system captures production and machine performance information.
Analyze
Teams review performance trends, downtime, production losses and OEE.
Identify
The data helps highlight recurring or significant areas of loss.
Improve
Teams implement process, maintenance, equipment or operational improvements.
Verify
Performance is measured again to determine whether the improvement produced the expected result.
This creates a more measurable approach to continuous improvement.
OEE as a Foundation for Production Efficiency
Overall Equipment Effectiveness , or OEE, is one of the most widely used frameworks for evaluating manufacturing equipment performance.
OEE combines three components:
Availability × Performance × Quality
Availability
Availability measures how much of the planned production time equipment was available for production.
Losses can include:
Equipment breakdowns
Setup
Changeovers
Material shortages
Maintenance
Unplanned stoppages
Performance
Performance considers whether equipment is producing at its expected rate.
Performance losses can result from:
Slow cycles
Reduced machine speed
Minor stoppages
Running below standard rates
Quality
Quality considers how much of the production output meets the required specification.
Quality losses can include:
Rejected products
Defective components
Rework
Scrap
When these factors are monitored together, production teams can gain a broader understanding of equipment effectiveness.
Production Efficiency Software Goes Beyond OEE
Although OEE is an important manufacturing KPI, continuous improvement teams should not rely on the OEE percentage alone.
An OEE score tells you that performance has changed. The next step is understanding why.
For example, if a production line's OEE decreases, the team should be able to investigate whether the change came from:
Increased downtime
Lower production speed
Increased rejection
Longer changeovers
More frequent minor stoppages
This is why detailed production analytics are important.
A useful production efficiency platform connects the KPI with the underlying production information.
Identify and Prioritize Production Losses
Not every production loss deserves the same level of attention.
Continuous improvement teams need to determine which problems have the greatest operational impact.
Production efficiency software can help organize losses according to factors such as:
Total lost time
Frequency
Machine
Production line
Product
Shift
Downtime reason
Historical trend
This can help teams focus improvement resources where they are most likely to create measurable results.
For example, a machine experiencing one large breakdown each month may require a different improvement approach from a machine experiencing dozens of short stoppages every shift.
Real-Time Production Performance Monitoring
Continuous improvement does not have to rely entirely on historical data.
Real-time production monitoring can provide visibility into what is happening during an active shift.
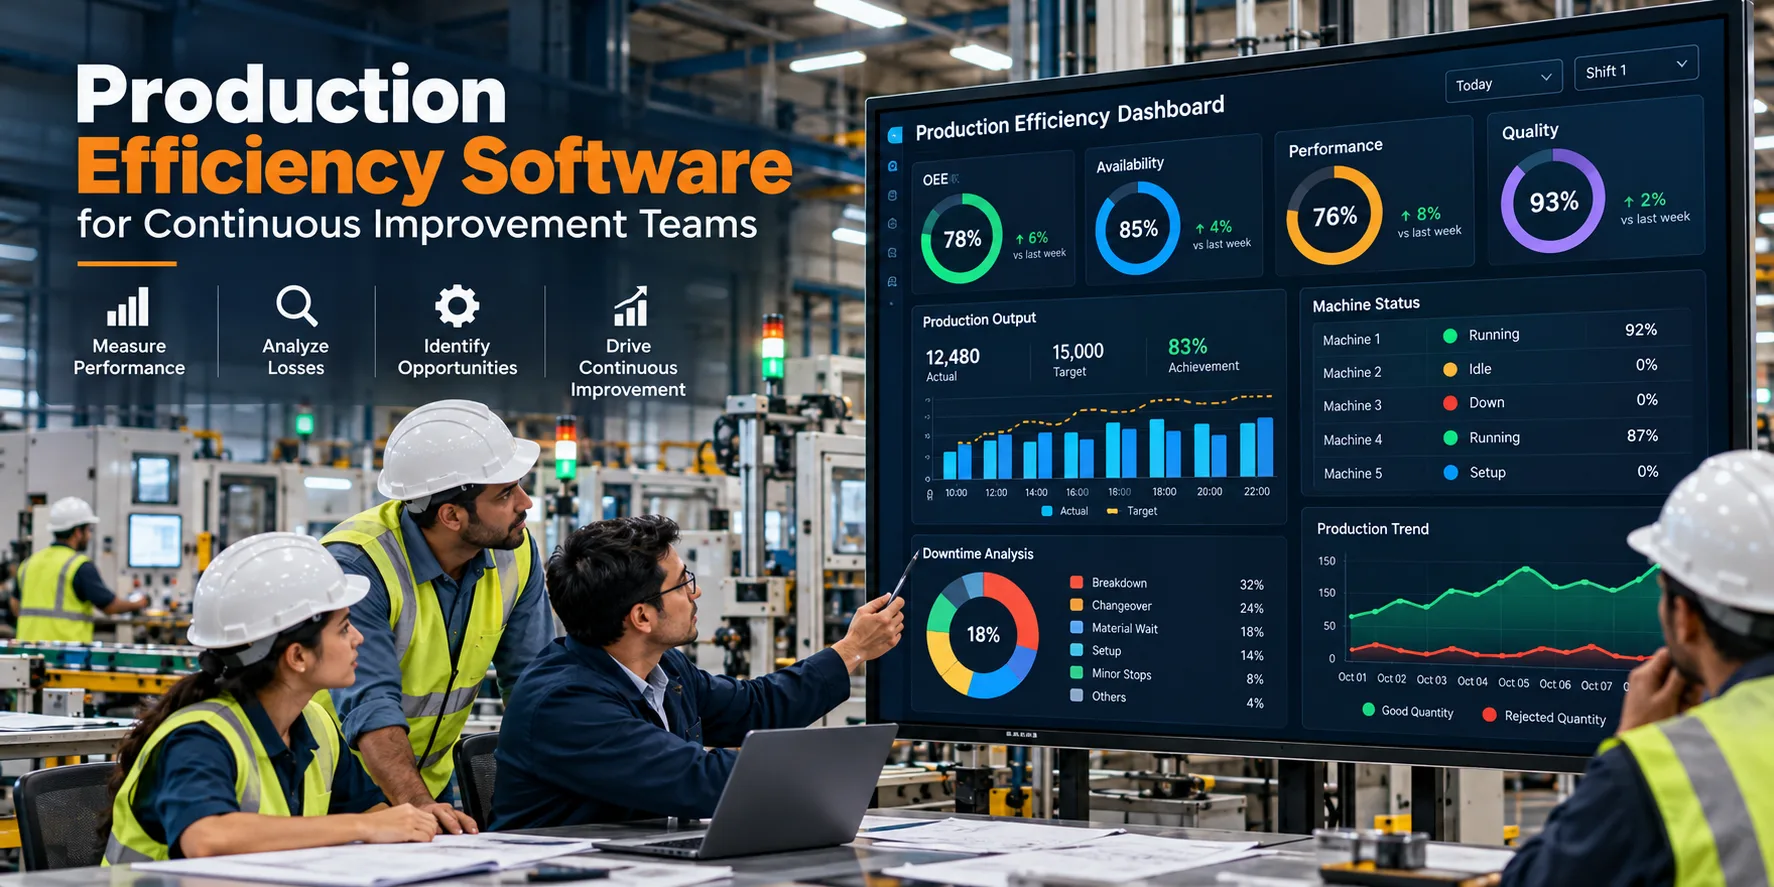
A production dashboard can display:
Current machine status
Current production
Target production
OEE
Availability
Performance
Quality
Active downtime
Production losses
This allows production teams and supervisors to identify deviations while production is still taking place.
For continuous improvement teams, real-time information can also help validate whether operational changes are producing the expected results.
Production Analytics for Root Cause Investigation
Production analytics can help teams move from identifying a problem to investigating its underlying cause.
Suppose a machine consistently produces below its expected output.
Historical data may reveal that the reduction occurs mainly during a particular shift or after specific product changeovers.
That information does not automatically identify the root cause, but it narrows the investigation.
The team can then examine relevant process conditions, equipment settings, maintenance records, material conditions or operating procedures.
This creates a stronger starting point for root cause analysis.
Track Improvements Over Time
One of the most important requirements of continuous improvement is proving that an improvement has produced a measurable result.
Suppose a team changes a machine setup procedure to reduce changeover time.
Before the change, the average changeover may have been recorded at a certain level.
After implementation, production data can be reviewed to determine whether the average time actually decreased.
The same approach can be applied to:
Downtime reduction
Cycle-time improvement
Quality improvement
Production output
Machine utilization
OEE improvement
Changeover reduction
This makes improvement measurable rather than purely qualitative.
Shift-Wise Production Efficiency Analysis
Production efficiency can vary between shifts for many reasons.
Differences may be related to:
Product mix
Machine condition
Material availability
Production scheduling
Changeovers
Process conditions
Equipment availability
A production efficiency platform can provide shift-wise analysis of production performance.
Teams can compare:
Production output
OEE
Downtime
Availability
Performance
Quality
Production target achievement
The purpose should not be to simply rank shifts. Instead, the data should help identify process conditions that require further investigation.
Machine-Level Efficiency Analysis
Plant-level KPIs provide useful management visibility, but continuous improvement teams often need more detailed information.
Machine-level analytics can help identify which equipment contributes most to production losses.
The numbers themselves do not explain the root cause, but they help direct attention toward the equipment where further analysis may be useful.
Production Efficiency Software for Plant Directors
For plant leadership, production efficiency software can provide a consolidated view of manufacturing performance.
Instead of reviewing multiple manually prepared reports, leadership can access key indicators such as:
Overall OEE
Production achievement
Downtime
Quality performance
Line performance
Shift performance
Production trends
This can help leadership understand where production performance is strong and where improvement initiatives may require additional attention.
For plant directors, the value is not simply operational visibility. It is the ability to connect manufacturing performance with improvement priorities.
Reduce Dependence on Manual Production Reports
Manual reporting can consume considerable time, particularly when data needs to be collected from multiple machines or production lines.
Operators or supervisors may need to record production information, consolidate spreadsheets and prepare shift reports.
Production efficiency software can automate parts of this process by collecting and presenting production information through dashboards and reports.
This can allow teams to spend less time preparing data and more time analyzing it.
Manual validation and operational context remain important, particularly when machine data does not capture the complete reason behind a production event.
Production Efficiency Software and Continuous Improvement Methodologies
Production efficiency data can complement established continuous improvement approaches.
Organizations using methodologies such as:
Lean Manufacturing
Six Sigma
Kaizen
Total Productive Maintenance
Operational Excellence
can use production data to support measurement and verification.
For example, a Kaizen initiative aimed at reducing machine downtime can use historical downtime data to establish a baseline and then measure performance after the improvement.
Similarly, a Six Sigma project can use production data as part of the measurement and analysis stages.
The software does not replace these methodologies. It provides the operational data that can make their application more measurable.
What Features Should Production Efficiency Software Include?
When evaluating production efficiency software, manufacturing organizations should consider whether the platform supports their operational requirements.
Important capabilities may include:
Real-Time Machine Monitoring
Visibility into current machine status and production activity.
OEE Monitoring
Tracking availability, performance and quality.
Downtime Tracking
Recording and analyzing production stoppages.
Production Analytics
Historical analysis of machine and production performance.
Shift-Wise Monitoring
Comparing production performance across shifts.
Multi-Line Visibility
Monitoring several machines or production lines from a centralized dashboard.
Production Reports
Generating structured reports for operational and management review.
Historical Trends
Analyzing performance over days, weeks and months.
Integration Capabilities
Connecting with machines, PLCs, sensors and existing manufacturing systems where required.
The right feature set depends on the plant's production process and digital infrastructure.
How to Select the Right Production Efficiency Software
Before implementing a platform, manufacturing organizations should define what they actually want to improve.
Some plants may primarily need better downtime visibility.
Others may be focused on:
OEE improvement
Production target achievement
Machine utilization
Quality losses
Production reporting
Multi-line monitoring
Continuous improvement analytics
The implementation should start with measurable objectives.
A practical evaluation can include questions such as:
What production data is currently available?
Which information is being collected manually?
Which machines need to be monitored?
What are the most significant known production losses?
Which KPIs should be monitored?
How will improvement results be measured?
Which existing systems need to be integrated?
Answering these questions can help ensure that the software solves a real operational problem rather than simply adding another technology layer.
Building a Data-Driven Continuous Improvement Culture
Technology alone does not create continuous improvement.
The value of production efficiency software comes from how teams use the information it provides.
When production data becomes accessible and consistent, teams can have more structured conversations about performance.
Instead of saying:
"This machine seems to be running slowly."
The conversation can become:
"This machine has consistently operated below its standard performance during these production conditions. Let's investigate why."
That shift from assumption to measurable evidence can strengthen the continuous improvement process.
The Long-Term Value of Production Efficiency Monitoring
A production efficiency platform can become more valuable as historical data accumulates.
Over time, organizations can build a detailed picture of:
Machine performance
Production trends
Downtime patterns
Quality losses
Shift performance
Equipment utilization
Improvement results
This historical information can support future improvement projects and provide a reference point for evaluating operational changes.
The goal is not simply to collect more data. The goal is to create a repeatable system for turning production data into operational decisions.
Final Thoughts
Continuous improvement requires more than identifying that production performance needs to improve. Teams need reliable information to understand where losses occur, determine which problems matter most and verify whether improvement initiatives are delivering measurable results.
Production efficiency software can provide the data and visibility required for this process by connecting production performance, machine efficiency, downtime, quality and OEE within a centralized monitoring environment.
For plant directors and continuous improvement teams, this can create a stronger foundation for data-driven manufacturing decisions.
The most effective approach is to start with the production problems that have the greatest operational impact, establish measurable baselines and use production data to continuously evaluate improvement.
Turn Production Data Into Continuous Improvement
If your manufacturing team wants better visibility into production efficiency, OEE, machine performance and production losses, the right monitoring platform can provide the foundation for a more measurable improvement process.
Contact Sales to discuss your manufacturing requirements and explore how production efficiency monitoring can support your continuous improvement initiatives.