Automated OEE Reporting Software for Manufacturing Operations
Production reports play an important role in manufacturing management. They help operations teams understand how much was produced, how much production time was lost, whether quality targets were achieved and how effectively machines performed during a shift.
However, preparing these reports can become difficult when production information is collected manually from multiple machines, spreadsheets and separate systems. Supervisors may spend valuable time consolidating data instead of investigating the problems affecting production.
This is where OEE reporting software can make a practical difference.
By bringing machine performance, production output, downtime and quality information into a centralized reporting system, manufacturers can reduce repetitive reporting work and improve visibility into operational performance.
For operations managers, the objective is straightforward: make production information more accessible, consistent and useful for decision-making.
What Is OEE Reporting Software?
OEE reporting software is a manufacturing solution that helps organizations calculate, organize and report Overall Equipment Effectiveness and related production metrics.
OEE stands for Overall Equipment Effectiveness . It measures equipment effectiveness through three components:
OEE = Availability × Performance × Quality
Availability measures how much of the planned production time a machine was available for production.
Performance measures how closely the machine operated against its expected production rate.
Quality measures the proportion of output that meets the required quality standard.
OEE reporting software combines these measurements with supporting production information to help teams understand machine and production performance.
Depending on the system configuration, reports may include:
Overall OEE
Machine-wise OEE
Production line performance
Planned and actual production
Downtime duration
Downtime reasons
Good and rejected quantities
Availability and performance trends
Production target achievement
Historical production comparisons
Instead of calculating these figures separately for every report, teams can use a consistent reporting process.
Why Manufacturing Operations Need Automated OEE Reporting
Many manufacturing plants already collect production information, but collecting data and making it useful are two different things.
A plant may have production counters, machine controllers and operator records. Yet if the information is spread across different sources, operations managers may struggle to obtain a complete view of performance.
Common reporting challenges include:
Manual data entry across multiple shifts
Repeated spreadsheet calculations
Inconsistent production figures
Delayed shift reports
Difficulty comparing machines
Limited visibility into downtime
Time-consuming monthly reporting
Errors caused by duplicate or incomplete records
These problems can make it difficult to identify recurring production losses.
Automated OEE reporting helps standardize how production data is collected, calculated and presented. Where reliable machine data is available, it can also reduce dependence on manual recording.
The result is a more consistent foundation for reviewing manufacturing performance.
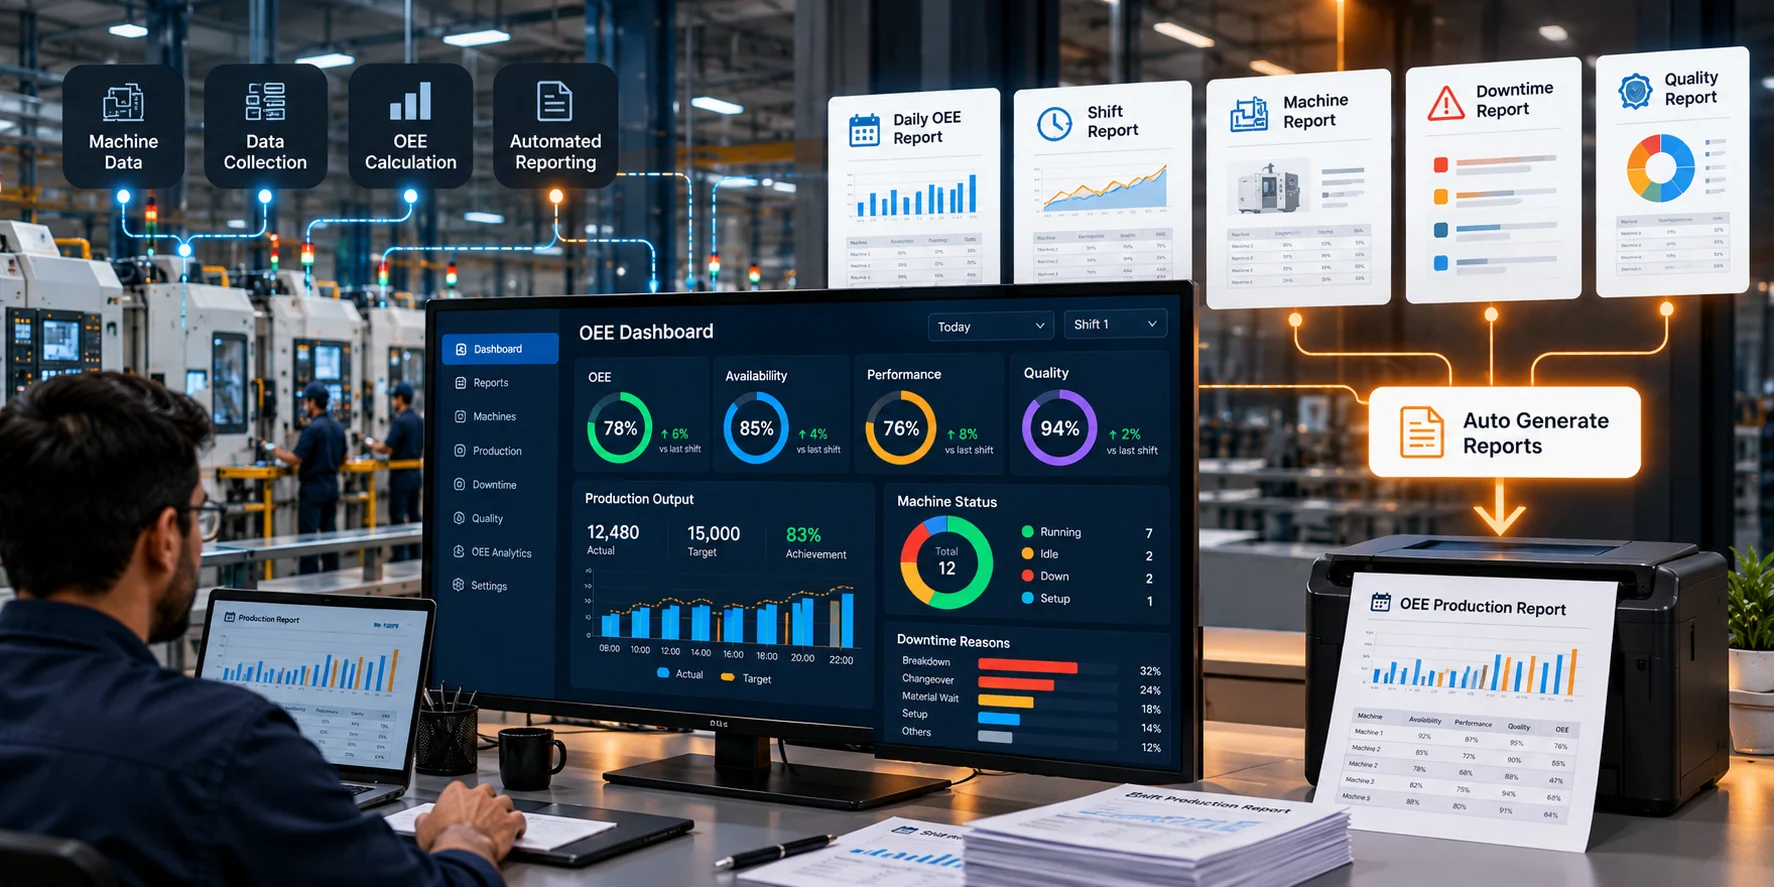
How Automated OEE Reporting Works
A typical automated reporting process follows a structured workflow.
Machine Data → Data Collection → OEE Calculation → Report Generation → Performance Review
1. Collect Production Data
The system obtains relevant information from available data sources, such as PLCs, machine controllers, production counters, sensors or integrated manufacturing applications.
The appropriate data collection method depends on the machine and existing factory infrastructure.
2. Calculate OEE Metrics
The system processes the collected data using configured production rules, cycle times, planned production time and quality information.
This produces the measurements needed to calculate availability, performance, quality and OEE.
3. Organize Production Information
Data can be grouped by machine, production line, shift, date or other configured parameters.
This allows different teams to review information relevant to their responsibilities.
4. Generate Reports
The system presents the calculated information through dashboards and reports.
Depending on the available features, reports may be viewed online, downloaded or distributed through configured reporting workflows.
5. Review and Take Action
Operations managers can use the reports to investigate performance gaps, compare production results and prioritize improvement activities.
Automation reduces repetitive reporting work, but the usefulness of the output still depends on accurate source data and properly configured calculations.
Essential Reports Every Manufacturing Plant Should Monitor
The most useful OEE reporting system provides more than a single overall percentage. Different reports help answer different operational questions.
1. Daily Production Report
A daily production report provides an overview of manufacturing activity during a specified period.
It may include:
Planned production
Actual production
Production target achievement
Machine utilization
Good production
Rejected production
Downtime
OEE
This report helps operations managers understand whether daily production objectives were achieved and where further investigation may be required.
2. Shift-Wise OEE Report
Production performance can vary across shifts due to differences in product mix, machine condition, material availability, changeovers and other operating conditions.
A shift-wise OEE report can show:
OEE by shift
Availability by shift
Performance by shift
Quality by shift
Production output
Downtime
Target achievement
Comparing these figures can help identify patterns that deserve investigation rather than relying on assumptions about why one shift performed differently.
3. Machine Performance Report
A machine performance report helps identify equipment that may be operating below expectations.
It can include machine status, production quantity, cycle time, availability, performance and OEE.
When several machines perform similar operations, this information can help managers identify equipment that requires additional attention.
Comparisons should account for differences in machine capability, product type and operating conditions.
4. Downtime Report
Downtime reports help quantify production time lost to equipment stoppages and other interruptions.
Depending on the system, reports may categorize downtime by:
Breakdown
Setup and changeover
Material shortage
Maintenance
Quality issues
Operator-related interruptions
Other configured downtime reasons
A useful downtime report should help teams identify both the duration and frequency of stoppages.
This makes it easier to distinguish occasional long breakdowns from repeated short interruptions.
5. Production Target vs. Actual Report
Manufacturing teams need to understand how actual output compares with planned production.
A target-versus-actual report can display planned quantity, actual quantity, production variance and target achievement.
When production falls behind schedule, managers can investigate whether the gap is related to downtime, reduced machine speed, quality losses or planning assumptions.
6. Quality Performance Report
Production quantity alone does not provide a complete picture of manufacturing performance.
Quality reports can show total output, accepted quantity, rejected quantity and rejection rates.
When combined with OEE data, these measurements help teams understand how quality losses affect effective production.
7. Historical OEE Trend Report
Historical reporting helps organizations evaluate performance across days, weeks and months.
It can reveal recurring downtime patterns, changes in machine effectiveness and the results of improvement initiatives.
For example, a plant can compare performance before and after a maintenance intervention to determine whether the measured results indicate an improvement.
Real-Time Dashboards and Automated Reports: What Is the Difference?
A real-time dashboard and an automated report serve related but different purposes.
A dashboard is primarily designed to provide an at-a-glance view of current or recent operational conditions.
Manufacturing organizations often benefit from using both. The dashboard supports day-to-day monitoring, while reports provide a structured record for analysis and review.
How OEE Reporting Helps Reduce Production Losses
Automated reporting does not reduce downtime by itself. Its value lies in making production losses easier to identify, quantify and investigate.
Consider a production line that repeatedly misses its target.
A production report may show that output is below plan. The supporting OEE report can help determine whether the shortfall is associated with availability, performance or quality.
If availability is low, the team can examine downtime records.
If performance is low, it can investigate cycle times and minor stoppages.
If quality is low, it can review rejection patterns and quality-related production losses.
This creates a more structured route from identifying a problem to understanding its likely causes.
Standardize Production Reporting Across Multiple Lines
Manufacturing plants with several production lines often struggle to compare results when each department uses a different reporting format.
One team may calculate downtime differently from another. Another may record production at a different level of detail.
An OEE reporting system can help standardize metrics and reporting structures across production areas.
This can support:
Consistent OEE calculations
Standardized downtime categories
Comparable shift reports
Centralized production summaries
Common KPI definitions
More consistent management reviews
Standardization is particularly important when comparing performance across machines, departments or facilities.
The organization should establish common definitions while allowing for genuine differences in machine configuration and production requirements.
Benefits of OEE Reporting Software for Operations Managers
Reduced Manual Reporting Effort
Automating data collection and calculations can reduce repetitive work associated with preparing production reports.
More Consistent Information
Standardized calculations and reporting formats can reduce discrepancies between reports.
Faster Access to Performance Data
Operations managers can access production information without waiting for every report to be compiled manually.
Better Downtime Visibility
Structured downtime reporting helps identify recurring interruptions and quantify their impact.
Easier Shift Reviews
Consistent shift reports provide a common basis for discussing production results and operational issues.
Improved Performance Analysis
Historical reporting helps teams identify trends and evaluate improvement initiatives.
Better Management Communication
Standardized production reports can make it easier to communicate operational performance to plant management and other stakeholders.
The actual benefits depend on the accuracy of the underlying data, the quality of implementation and how consistently teams use the information.
What to Look for in Manufacturing Reporting Software
When evaluating OEE reporting software, manufacturers should consider both reporting capabilities and the quality of the underlying data collection process.
Important features may include:
Automated OEE Calculation: Consistent calculation of availability, performance, quality and OEE.
Configurable Reports: The ability to select relevant machines, lines, shifts and reporting periods.
Production Dashboards: Visual summaries of current and historical manufacturing KPIs.
Downtime Analysis: Categorization and analysis of stoppage duration and frequency.
Shift-Wise Reporting: Production summaries aligned with actual shift schedules.
Historical Data: Access to past production information for comparison and trend analysis.
Export Options: Download or share reports in supported formats where required.
Machine Integration: Connectivity with suitable PLCs, controllers, sensors or production data sources.
Access Control: Appropriate permissions for operators, supervisors, managers and administrators.
Scalability: The ability to accommodate additional machines and production lines as monitoring requirements expand.
The right solution should match the plant's reporting needs rather than offering features that will not be used.
How to Implement Automated OEE Reporting
A successful implementation begins with understanding how the plant currently collects and reviews production information.
Step 1: Review Existing Reports
Identify which reports are currently prepared manually, how frequently they are generated and which metrics they contain.
Step 2: Define KPI Calculation Rules
Agree on planned production time, ideal cycle time, downtime categories, production quantity and quality definitions.
Consistent rules are essential for meaningful OEE reporting.
Step 3: Identify Data Sources
Determine which information can be collected automatically and where operator input or manual validation will remain necessary.
Step 4: Select a Pilot Production Area
Start with a machine or production line where reporting challenges are clearly understood.
Step 5: Validate the Results
Compare system-generated reports against verified production records. Investigate discrepancies before using the reports for operational decisions.
Step 6: Establish a Reporting Routine
Define who reviews daily, shift-wise and monthly reports, and how identified issues are followed up.
Step 7: Expand Gradually
Once the reporting process is validated, extend it to additional machines or production lines as appropriate.
This approach helps ensure that automated reporting produces reliable information rather than simply digitizing existing inconsistencies.
Common Mistakes to Avoid
Automating Inaccurate Data
Automation cannot correct incorrect machine counts, incomplete production records or poorly defined calculation rules on its own.
Creating Too Many Reports
Excessive reporting can overwhelm users. Focus on reports that support specific operational decisions.
Ignoring Downtime Reasons
Total downtime is useful, but categorizing stoppages provides more information for investigation.
Using Different OEE Definitions
Comparisons become misleading when machines or departments use inconsistent calculation rules.
Failing to Review Reports
Automated reports provide limited value if teams do not use them to investigate issues or track improvements.
Overlooking Historical Comparisons
Current performance matters, but historical trends are essential for understanding recurring losses and the effects of corrective actions.
How OEE Reporting Supports Continuous Improvement
Continuous improvement requires a consistent way to measure performance before and after a change.
Automated OEE reporting can help teams establish a baseline, identify a problem and evaluate the results of corrective actions.
For example, if a plant introduces a new maintenance procedure, the team can compare downtime and availability before and after implementation.
If a process change is intended to improve production speed, performance metrics can help evaluate the outcome.
The process follows a simple cycle:
Measure → Analyze → Improve → Verify
Reporting makes the results easier to review consistently. It does not replace root cause analysis or the operational expertise needed to determine which improvements are appropriate.
Frequently Asked Questions
What is OEE reporting software?
OEE reporting software calculates and presents Overall Equipment Effectiveness and related production metrics. It helps manufacturers review machine availability, performance, quality, downtime and production output through structured reports and dashboards.
Can OEE reports be generated automatically?
Yes, where the software supports automated reporting and the required production data is available. Reports may be generated using configured time periods, shifts, machines or production lines. Some information may still require operator input or validation.
Which reports are most useful for manufacturing operations?
Daily production reports, shift-wise OEE reports, machine performance reports, downtime reports, quality reports and historical OEE trends are common starting points.
Does OEE reporting software require PLC integration?
Not necessarily. Some implementations can use production counters, sensors, operator inputs or existing databases. PLC integration may be suitable when the required machine data is available through PLC interfaces.
How does automated OEE reporting improve productivity?
It helps teams identify performance gaps, quantify downtime, review production losses and measure improvement results. Productivity improvements depend on how effectively the organization acts on the findings.
What is the difference between OEE software and OEE reporting software?
OEE software may cover data collection, real-time monitoring, calculations, dashboards, downtime tracking and analysis. OEE reporting software emphasizes the reporting and presentation of those measurements. Many manufacturing platforms provide both capabilities.
Final Thoughts
Accurate production reporting is essential for understanding manufacturing performance, but preparing reports manually can consume time and introduce inconsistencies.
OEE reporting software helps manufacturers organize machine performance, production output, downtime and quality information into a consistent reporting process.
For operations managers, this can improve visibility across shifts and production lines, reduce repetitive reporting work and provide a stronger basis for investigating production losses.
The most effective implementation combines reliable data collection, clearly defined OEE calculations and reports that answer real operational questions.
When production information is accurate, accessible and consistently reviewed, reporting becomes more than a documentation task. It becomes a practical tool for managing performance and supporting continuous improvement.
Simplify Your Manufacturing Reporting
If your team spends significant time preparing production reports or struggles to compare OEE across machines and shifts, automated reporting may help streamline the process.
Request a Demo to explore how OEE monitoring and automated production reporting can support your manufacturing operations.