Introduction
Manufacturing groups operating multiple factories face a common challenge: maintaining consistent production visibility across different locations. Each plant may have its own production lines, machines, operating schedules, supervisors, and reporting methods. While individual facilities may track their production performance, consolidating this information at the corporate level can be difficult.
For corporate operations teams, this creates a gap between local manufacturing visibility and enterprise-level decision-making. Plant managers may know how their own facilities are performing, but leadership teams often need a consolidated view to understand which plants are meeting production targets, where equipment losses are occurring, and which locations require operational attention.
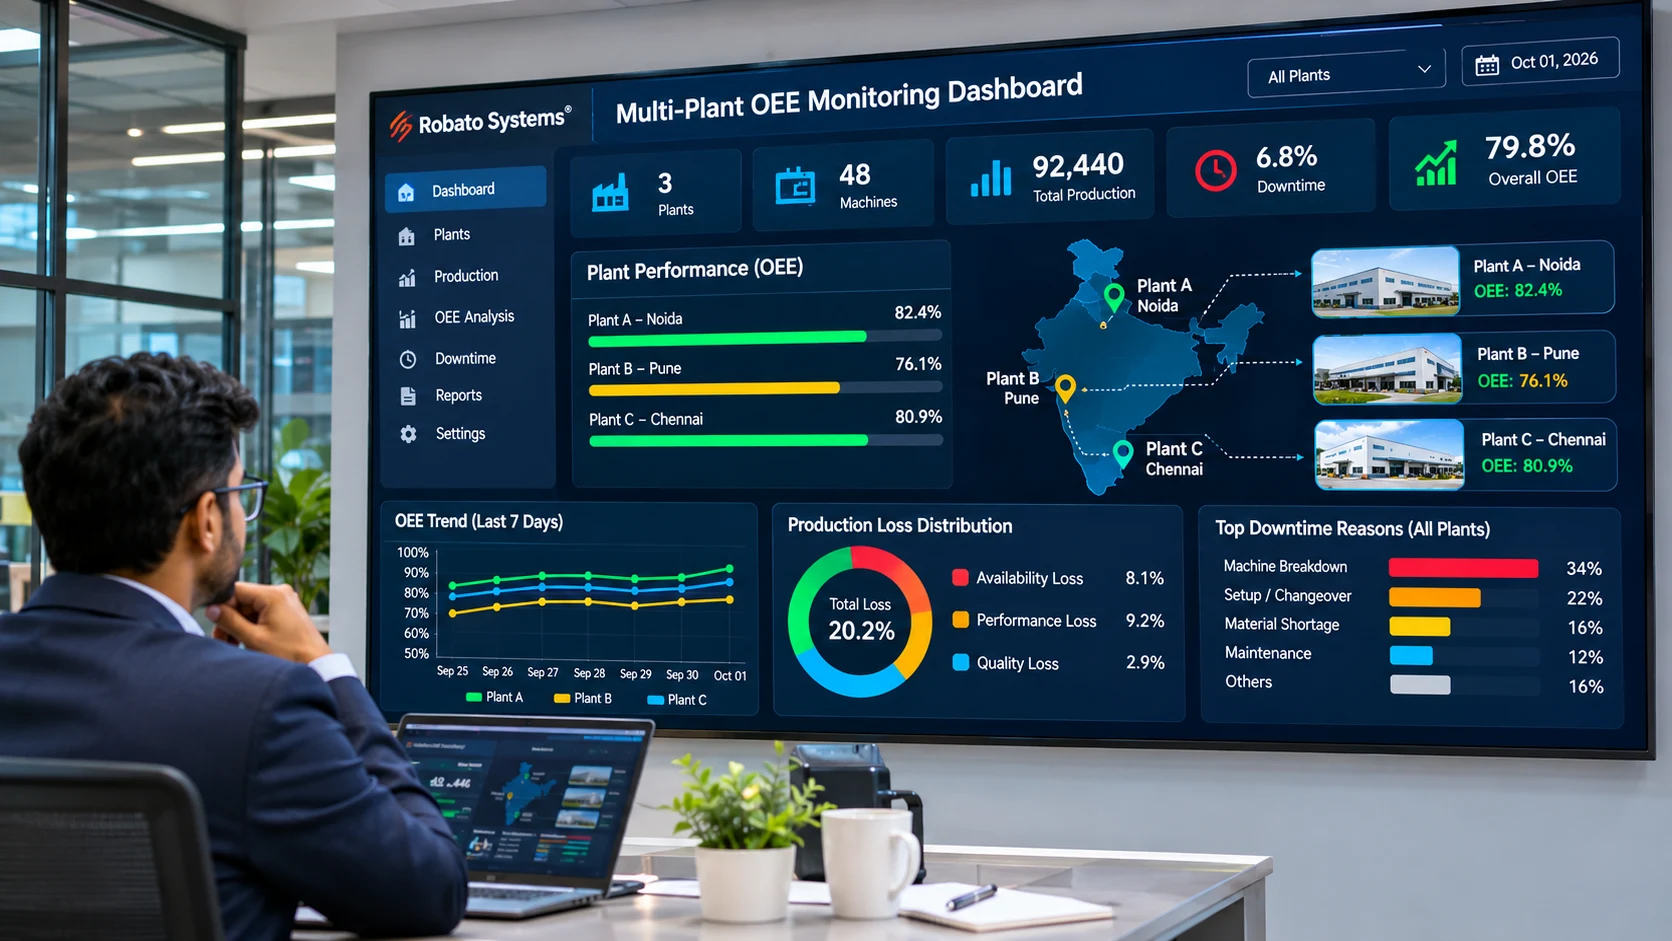
OEE Monitoring for Multiple Plants helps manufacturing groups bring equipment effectiveness data from different facilities into a centralized monitoring environment. Using Overall Equipment Effectiveness (OEE) metrics, organizations can evaluate availability, performance, and quality across machines, production lines, and manufacturing locations.
A multi-plant OEE monitoring dashboard provides a common performance view for corporate teams while allowing individual facilities to monitor their own operations.
This approach supports better production visibility, consistent performance measurement, and data-driven improvement across geographically distributed manufacturing facilities.
What Is Multi-Plant OEE Monitoring?
Multi-plant OEE monitoring is the process of collecting, consolidating, and analyzing equipment performance information across multiple manufacturing facilities.
Instead of reviewing separate spreadsheets and reports from every factory, organizations can use a centralized OEE platform to view production performance across their manufacturing network.
A typical multi-plant monitoring structure may include:
Corporate-level dashboard for overall manufacturing visibility.
Plant-level dashboards for individual factory performance.
Production-line monitoring within each plant.
Machine-level monitoring for equipment effectiveness.
Shift-wise reporting for operational comparisons.
Historical performance reports for trend analysis.
For example, a manufacturing group operating three factories can monitor OEE at each location through a common reporting structure.
Corporate management can review overall performance, while plant managers can access detailed information about the machines and production lines under their responsibility.
The objective is to create consistent performance visibility without requiring every facility to operate in exactly the same way.
Why Manufacturing Groups Need Centralized OEE Monitoring
Managing multiple factories involves more than monitoring production output. Corporate operations teams need reliable information to evaluate performance, identify operational differences, and prioritize improvement activities.
1. Separate Production Reporting Systems
Different factories may use different reporting formats, spreadsheets, or machine monitoring systems.
This makes it difficult to compare production performance because information may be collected using different definitions and reporting intervals.
A centralized OEE monitoring platform can establish common reporting parameters and consolidate performance information across locations.
2. Limited Corporate-Level Visibility
When production data remains within individual facilities, senior management may depend on periodic reports to understand manufacturing performance.
These reports can become outdated before leadership has an opportunity to respond to operational problems.
A centralized dashboard provides more timely visibility into machine and production performance, subject to the data collection and update frequency of each facility.
3. Difficulty Comparing Plant Performance
A manufacturing group may operate facilities with different machine capacities, production processes, and product mixes.
Without consistent OEE definitions, comparing performance across locations can lead to misleading conclusions.
Centralized monitoring helps standardize measurement methods while allowing teams to account for differences in production conditions.
4. Delayed Identification of Production Losses
Unexpected downtime, reduced machine speed, and quality issues can affect production output at any location.
If these issues are visible only through local reporting, corporate teams may not identify recurring patterns across multiple plants.
Consolidated OEE information helps highlight areas that require further investigation.
5. Inconsistent Improvement Practices
One factory may have successfully reduced downtime through maintenance improvements, while another facility continues to experience similar equipment problems.
Comparing operational trends can help organizations identify practices worth evaluating at other locations.
However, improvement methods should always be adapted to the equipment, process, and operating conditions of each facility.
How a Multi-Plant OEE Monitoring Dashboard Works
A multi-plant OEE dashboard brings together machine and production information from different manufacturing locations.
Although the exact architecture depends on the software and connectivity requirements, the monitoring process generally follows a structured approach.
Step 1: Collect Machine and Production Data
Each manufacturing facility has its own machines, controllers, production systems, and operational processes.
Relevant machine information may be collected through:
PLC-based machine connectivity.
Industrial sensors.
Machine controllers.
Production counters.
Configured digital inputs.
Existing production data interfaces.
The available integration method depends on the machine's technical capabilities and the signals required for OEE calculation.
Step 2: Process Production Information
Collected information is converted into useful production parameters.
These may include machine running time, downtime, production quantity, ideal cycle time, and good or rejected quantities.
Data validation is important because inconsistent machine signals or incorrect production parameters can affect the accuracy of OEE calculations.
Step 3: Calculate OEE Metrics
The system calculates Overall Equipment Effectiveness using three components:
OEE = Availability × Performance × Quality
Availability: Measures operating time against planned production time.
Performance: Measures actual production speed against ideal production speed.
Quality: Measures good production against total production.
These calculations can be performed at machine, production-line, shift, and plant levels, depending on the configured reporting structure.
Step 4: Consolidate Data Across Plants
The performance information from individual facilities is made available through a centralized monitoring environment.
Corporate users can review plant-level summaries, while authorized local users can access more detailed operational information.
Step 5: Display Enterprise-Level Performance
A multi-plant dashboard presents relevant production KPIs in a common interface.
This helps leadership review performance across manufacturing locations and identify areas that require operational attention.
Key Features of Multi-Plant OEE Monitoring Software
Manufacturing groups should evaluate OEE platforms based on their ability to support centralized monitoring, plant-level operations, and consistent performance reporting.
1. Centralized Enterprise Dashboard
A centralized dashboard provides a consolidated view of manufacturing performance across different facilities.
Depending on system configuration, it may display:
Total connected plants.
Machine running and stopped status.
Plant-wise OEE.
Production output.
Downtime duration.
Availability, performance, and quality.
Production target achievement.
Plant-level performance trends.
This reduces the need to collect separate reports from every manufacturing location.
2. Plant-Wise Performance Monitoring
Corporate operations teams need the ability to review each manufacturing facility independently.
Plant-wise monitoring helps identify locations experiencing lower equipment effectiveness, recurring downtime, or production target gaps.
It also allows local plant managers to investigate their own operational data.
3. Machine and Production-Line Visibility
Enterprise-level performance figures should be supported by detailed operational information.
Users should be able to move from a plant-level summary to production-line and machine-level reports, subject to their access permissions.
This helps teams investigate the equipment or production processes contributing to performance variations.
4. Standardized OEE Calculation
Different factories may have different production schedules, machine capacities, and product requirements.
The OEE platform should support clearly defined calculation rules for:
Planned production time.
Planned stops and excluded periods.
Ideal cycle times.
Total production quantities.
Good and rejected production.
Downtime classification.
Consistent definitions make plant-to-plant comparisons more meaningful.
5. Shift-Wise Production Reporting
Manufacturing groups often operate multiple shifts across different facilities.
Shift-wise reporting helps teams compare production performance, machine availability, and downtime across operating periods.
The system should support the relevant shift schedules and local time settings of each facility.
6. Centralized Downtime Analysis
Downtime is one of the important factors affecting equipment availability.
A multi-plant monitoring platform should help teams review downtime duration, frequency, and recorded reasons across manufacturing locations.
This makes it easier to identify recurring machine stoppages and prioritize maintenance investigations.
7. Role-Based User Access
Different users require different levels of production information.
For example:
Corporate management may need consolidated plant-level visibility.
Plant managers may require access to their facility's production performance.
Production supervisors may need line-level and shift-level information.
Maintenance teams may need machine status and downtime records.
Role-based access helps control which information users can view or manage.
8. Historical Reports and Performance Trends
Historical information helps manufacturing groups evaluate changes in equipment effectiveness over time.
Teams can review daily, weekly, and monthly trends to understand whether production improvements are sustained.
This is especially useful when evaluating performance before and after maintenance or process improvement initiatives.
Example: Comparing OEE Across Multiple Manufacturing Plants
Consider a manufacturing group operating three facilities.
Each plant produces different components but follows a common OEE measurement framework.
The following example illustrates how corporate operations teams might compare plant-level performance.
Performance Metric | Plant A | Plant B | Plant C |
|---|---|---|---|
Availability | 90% | 85% | 92% |
Performance | 92% | 90% | 86% |
Quality | 98% | 97% | 99% |
OEE | 81.14% | 74.21% | 78.41% |
The OEE values are calculated by multiplying availability, performance, and quality.
What Does This Comparison Tell Management?
Plant A: Has the highest OEE in this example. Its availability and performance are relatively balanced.
Plant B: Has the lowest OEE, with availability being its lowest component. Management may investigate machine downtime and operating interruptions.
Plant C: Has the highest availability but lower performance. The team may investigate cycle times, minor stoppages, or operating speed.
This comparison helps corporate teams identify where further investigation may be useful.
However, OEE scores should not be used as the only basis for ranking factories. Differences in product mix, machine type, operating schedules, ideal cycle times, and calculation rules must be considered before drawing conclusions.
Cloud-Based Architecture for Multi-Plant OEE Monitoring
Manufacturing groups with geographically distributed factories often need a practical way to consolidate production information.
A cloud-based architecture can support centralized monitoring by making authorized plant data accessible through a common platform.
A typical architecture may include:
Factory Equipment: Machines, PLCs, sensors, and production counters generate operational information.
Data Collection Layer: Industrial gateways or supported connectivity methods collect relevant machine signals.
Data Communication: Configured network connections transmit the required information to the central platform.
Centralized Data Platform: Production information is processed and organized for OEE calculations and reporting.
Enterprise Dashboard: Authorized corporate and plant users access the relevant performance information.
Internal link placement: Add an internal link on the anchor text Cloud Dashboard to the Robato Systems Cloud Dashboard page in this section.
Important Considerations for Multi-Plant Connectivity
Before implementation, manufacturers should evaluate:
Internet availability at each facility.
Network security requirements.
Secure communication between plant networks and the monitoring platform.
Data synchronization and temporary connectivity interruptions.
Time-zone and shift-schedule differences.
User authentication and access permissions.
Data retention and backup requirements.
Cloud connectivity should be designed around the organization's IT policies and operational requirements. Facilities with restricted networks may require alternative deployment or data communication arrangements.
How to Implement OEE Monitoring Across Multiple Manufacturing Plants
A multi-plant implementation should be planned carefully to avoid inconsistent data and unnecessary complexity.
Step 1: Assess Each Manufacturing Facility
Begin by documenting the machines, production lines, controllers, and existing monitoring systems at every plant.
Identify which machines are critical for production output and which equipment should be included in the initial implementation.
Step 2: Define Common OEE Standards
Establish common rules for calculating availability, performance, and quality.
Define how planned downtime, breaks, changeovers, ideal cycle times, and rejected quantities will be treated.
Allow plant-specific configurations where production processes require them, while maintaining consistent reporting definitions wherever comparisons are intended.
Step 3: Select a Pilot Plant
Instead of deploying the platform across every facility immediately, begin with one representative plant.
Use the pilot to verify machine connectivity, data accuracy, dashboard requirements, reporting structures, and user access.
Step 4: Configure the Centralized Dashboard
Set up the enterprise-level dashboard with a clear hierarchy:
Organization → Plant → Production Line → Machine
This structure helps users navigate from consolidated performance information to detailed equipment reports.
Step 5: Expand to Additional Plants
After validating the pilot, extend the monitoring system to other facilities.
Use standardized configurations where possible, while accounting for differences in equipment, production processes, and connectivity.
Step 6: Train Corporate and Plant-Level Teams
Corporate operations, plant managers, supervisors, and maintenance teams should understand how OEE is calculated and how to interpret the reports.
Training should also cover data quality, downtime classification, and responsibilities for reviewing production performance.
Step 7: Review Performance Across the Manufacturing Network
Once multiple facilities are connected, establish regular performance reviews.
Use plant-level and enterprise-level reports to identify recurring losses, compare operational trends, and prioritize improvement initiatives.
Benefits of Multi-Plant OEE Monitoring for Manufacturing Groups
A centralized OEE monitoring platform can support manufacturing organizations in several ways when implemented with reliable data and consistent operational processes.
Better Enterprise-Level Production Visibility
Corporate teams can review production performance across multiple locations through a centralized reporting environment.
Consistent Performance Measurement
Common OEE definitions make it easier to evaluate equipment effectiveness across manufacturing facilities.
Faster Identification of Operational Issues
Consolidated reporting can highlight plants, production lines, or machines that require further investigation.
Improved Production Benchmarking
Organizations can compare performance trends while accounting for differences in products, processes, and operating conditions.
Better Coordination Between Plants
Shared performance information can support discussions between corporate operations teams and local plant managers.
Data-Driven Improvement Planning
Historical OEE and downtime information can help management prioritize maintenance, process optimization, and production improvement activities.
Reduced Dependence on Separate Manual Reports
Centralized data collection and reporting can reduce the effort required to consolidate information from different factories, depending on the level of system integration.
How to Choose the Right Enterprise OEE Monitoring Software
Selecting software for a multi-plant manufacturing group requires consideration of both technical and operational requirements.
Before choosing a platform, evaluate the following:
Multi-Plant Support: Ability to manage multiple manufacturing facilities within a common reporting structure.
Machine Connectivity: Compatibility with the PLCs, controllers, sensors, and data sources used at each plant.
Centralized Dashboard: Ability to display consolidated and plant-specific performance.
Scalability: Support for additional machines, production lines, and manufacturing locations.
OEE Configuration: Flexibility to configure machine-specific cycle times, shifts, and production parameters.
Downtime Reporting: Ability to track and analyze machine stoppages across locations.
User Permissions: Support for corporate, plant, production, and maintenance user roles.
Historical Analytics: Access to performance trends and previous production records.
Integration: Compatibility with relevant ERP, MES, maintenance, and manufacturing systems.
Security: Appropriate authentication, authorization, and data protection controls.
The selected platform should match the organization's existing infrastructure and long-term manufacturing monitoring strategy.
Conclusion
Manufacturing groups operating multiple facilities need a consistent way to understand equipment effectiveness and production performance across their entire manufacturing network.
When every factory maintains separate production reports, corporate teams may struggle to compare performance, identify recurring losses, and prioritize improvement activities.
OEE Monitoring for Multiple Plants provides a structured approach to consolidating availability, performance, and quality information across different manufacturing locations.
With a centralized dashboard, plant-wise monitoring, machine-level reporting, and historical performance analysis, organizations can gain better visibility into their manufacturing operations.
For corporate operations teams, the objective is not simply to compare OEE percentages. It is to understand the production conditions behind those figures and use reliable information to improve operational performance across facilities.
Monitor Multiple Manufacturing Plants with Robato Systems
Robato Systems offers industrial production monitoring solutions that help manufacturers improve visibility into machine activity and production performance.
If your organization operates multiple factories and wants a centralized view of equipment effectiveness, production output, and downtime, connect with the Robato Systems team to discuss your requirements.
Request a Demo to explore how OEE monitoring can support production visibility across your manufacturing facilities.