Factory OEE Dashboard for Enterprise-Level Visibility
A manufacturing plant generates production information throughout every shift. Machines produce components, operators record output, maintenance teams respond to breakdowns, and supervisors monitor production targets. Yet bringing all this information together into a clear picture of factory performance can be challenging.
When production data is scattered across machines, spreadsheets and separate reporting systems, plant heads may struggle to understand which production lines are performing well and where attention is required.
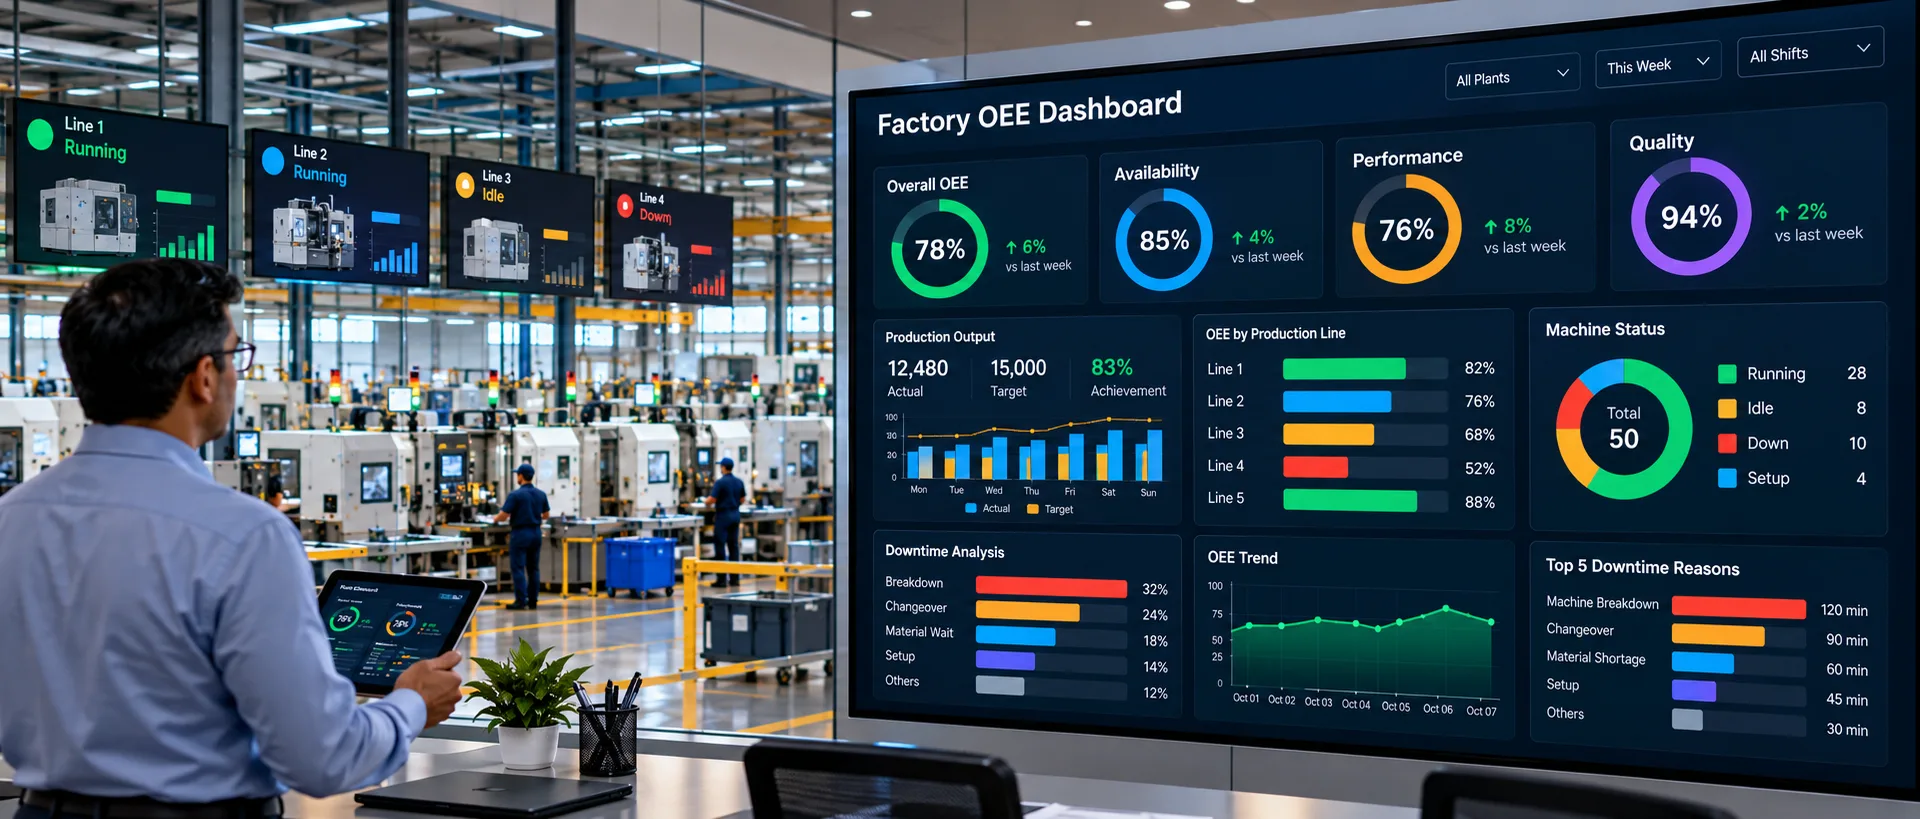
A Factory OEE Dashboard helps address this challenge by bringing equipment effectiveness, production output, downtime and quality information into a centralized view.
Instead of reviewing multiple reports to understand plant performance, manufacturing leaders can monitor key indicators and investigate production losses through a common dashboard.
For factories managing several production lines, this visibility can support faster operational reviews, more consistent performance measurement and better-informed improvement decisions.
What Is a Factory OEE Dashboard?
A factory OEE dashboard is a digital monitoring interface that displays Overall Equipment Effectiveness and related manufacturing performance indicators.
OEE stands for Overall Equipment Effectiveness . It measures how effectively equipment is used during planned production time by combining three factors:
OEE = Availability × Performance × Quality
Availability: The proportion of planned production time during which equipment is available for production.
Performance: How closely the equipment operates against its expected production rate.
Quality: The proportion of production that meets the required quality standard.
A factory dashboard can present these measurements alongside other operational indicators, including production targets, machine status, downtime, rejected quantities and shift-wise performance.
Depending on the monitoring platform, the information can be displayed at machine, production-line, department or plant level.
The objective is to provide a consistent view of manufacturing performance without requiring managers to consolidate every report manually.
Why Plant Heads Need Enterprise-Level Production Visibility
As manufacturing operations grow, the number of machines, production lines and operational dependencies also increases.
A plant head may be responsible for several departments, each with different production targets, equipment and operating conditions.
Without centralized monitoring, reviewing the entire facility can require considerable effort.
Common challenges include:
Limited visibility into individual machine performance
Delayed production reports
Difficulty comparing production lines
Inconsistent KPI calculations
Hidden downtime losses
Limited insight into target achievement
Difficulty identifying recurring production problems
Time-consuming performance reviews
A factory OEE dashboard can bring these indicators together, giving plant leadership a consolidated starting point for evaluating operations.
It does not eliminate the need for detailed investigation. Instead, it helps managers identify where deeper analysis may be necessary.
Key Metrics to Display on a Factory OEE Dashboard
An effective manufacturing dashboard should prioritize metrics that help users understand performance and take action.
1. Overall OEE
Overall OEE provides a combined view of equipment availability, performance and quality.
Plant heads can use it to compare performance across production areas, provided the calculation rules and operating conditions are consistent.
However, OEE should not be treated as a standalone measure of business performance. It is most useful when supported by the underlying production data.
2. Machine Availability
Availability helps identify how much planned production time is being lost because equipment is unavailable.
A dashboard may display availability by machine, production line, shift or department.
Low availability can indicate a need to investigate breakdowns, changeovers, material shortages or other interruptions.
3. Production Performance
Performance monitoring helps identify whether machines are operating at their expected production rates.
A machine may remain operational while producing below its standard speed.
Monitoring performance can help teams investigate slow cycles, minor stoppages and other causes of reduced output.
4. Quality Performance
Quality indicators show how much production meets the required specification.
A factory dashboard can display good quantities, rejected quantities and quality percentages to help managers understand how defects affect effective production.
5. Production Target Achievement
Comparing planned and actual production helps identify whether the plant is on track to meet its production commitments.
This information can be viewed across shifts, machines and production lines.
6. Downtime
Downtime indicators help reveal production interruptions and their impact.
Where downtime categorization is available, the dashboard can also show which causes account for the greatest amount of lost time.
7. Machine Running Status
A centralized machine-status view can help supervisors quickly identify equipment that is running, idle or experiencing downtime.
The status categories depend on the machine signals and rules configured during implementation.
How a Factory OEE Dashboard Works
A factory OEE dashboard depends on collecting and processing production information from available data sources.
A typical workflow looks like this:
Machines and Sensors → Data Collection → Production Processing → OEE Calculation → Dashboard → Operational Action
Step 1: Collect Machine Data
Data may be obtained from PLCs, machine controllers, production counters, sensors or other connected systems.
The appropriate method depends on the equipment and the information available.
Step 2: Process Production Information
The system organizes the incoming information according to machine configuration, production schedules, cycle times and quality data.
Step 3: Calculate OEE
Availability, performance and quality are calculated using the configured production rules.
Step 4: Display Manufacturing KPIs
The dashboard presents key measurements in a visual format that helps users understand current and historical performance.
Step 5: Investigate Performance Losses
When a metric falls outside the expected range, managers can review the supporting information to investigate the cause.
This process connects machine-level information with plant-level operational visibility.
Monitor Multiple Production Lines from One Dashboard
A major advantage of a factory OEE dashboard is the ability to view multiple production lines through a common interface.
For example, a plant may operate separate machining, assembly, inspection and packaging areas.
Each department has different operational requirements, but plant leadership still needs a consistent view of overall performance.
A multi-line dashboard can show:
OEE by production line
Availability by machine
Production output by department
Downtime by line
Quality performance
Target achievement
Shift-wise production results
These figures are illustrative, not industry benchmarks or actual customer results.
The table demonstrates how a manager can compare production areas and identify which line may require further investigation.
For Line B, availability may be an important area to examine. For Line D, quality may deserve closer attention despite its higher overall OEE.
The next step is to review the underlying production conditions rather than drawing conclusions from percentages alone.
Factory OEE Dashboard vs. Traditional Production Reports
Traditional production reports remain useful for documentation, shift handovers and historical reviews. However, they may not provide the same level of immediate visibility as a live dashboard.
Traditional ReportingFactory OEE DashboardOften reviewed after a reporting periodCan display current production informationMay require manual consolidationCan centralize connected production dataSeparate reports for different machinesUnified view of multiple machines and linesHistorical summaries are commonCurrent and historical visibilityComparisons may require manual analysisVisual comparisons can simplify reviews
The best approach depends on the factory's needs. Many organizations benefit from combining dashboards for operational monitoring with structured reports for analysis and recordkeeping.
Real-Time Factory Monitoring for Faster Decisions
When production information becomes available during an active shift, teams have a better opportunity to respond to emerging issues.
For example, if a critical machine stops unexpectedly, its status may appear on the dashboard shortly after the event is detected.
A supervisor can then investigate the stoppage and coordinate with the relevant maintenance or production team.
Similarly, if actual output begins falling behind the target, managers can examine machine speed, downtime and quality information to understand the shortfall.
Real-time monitoring does not guarantee that every issue will be resolved immediately. Its value is that it reduces the delay between identifying a production problem and beginning an investigation.
Using the Dashboard to Identify Hidden Production Losses
Production losses can accumulate through several different mechanisms.
A machine may experience a major breakdown, but it may also lose time through repeated minor stops, extended changeovers or slower-than-expected cycles.
A factory OEE dashboard can help reveal these patterns when the relevant information is collected.
For example:
Low availability may indicate excessive downtime.
Low performance may indicate reduced operating speed.
Low quality may indicate increased rejection or rework.
Missed production targets may indicate a capacity or scheduling problem.
These indicators provide a starting point for investigation.
Plant teams can then use downtime records, maintenance history, production schedules and operator feedback to determine the underlying causes.
Improve Shift-Wise Performance Reviews
Shift handovers are important opportunities to communicate production conditions, outstanding issues and performance results.
A factory OEE dashboard can make these reviews more consistent by presenting comparable information for each shift.
Managers may review:
Shift-wise OEE
Production output
Target achievement
Downtime
Machine availability
Rejected quantities
Outstanding equipment issues
This creates a common set of measurements for production reviews.
When differences appear between shifts, teams should investigate factors such as product mix, planned maintenance, material availability and operating conditions before attributing the results to individual performance.
Historical Analytics for Manufacturing Improvement
A dashboard becomes more useful when it provides access to historical production information as well as current status.
Historical analytics can help plant teams understand whether performance is improving, declining or remaining stable.
Useful comparisons include:
Daily OEE trends
Weekly production performance
Monthly downtime
Machine-wise availability
Quality trends
Shift performance
Production target achievement
For example, a plant may introduce a corrective maintenance procedure and compare downtime before and after implementation.
The data can help determine whether the intervention is associated with a measurable improvement.
Other operational factors should also be considered when interpreting the results.
Factory OEE Dashboard for Enterprise Manufacturing
Manufacturing groups may operate several departments or plants with different production processes.
A scalable monitoring strategy can help establish common KPI definitions and reporting practices across these operations.
Depending on the platform, enterprise-level visibility may include:
Plant-level OEE summaries
Production-line comparisons
Machine performance details
Standardized reporting
Role-based dashboard access
Historical performance trends
Multi-location monitoring
However, enterprise visibility requires more than placing every machine on a single screen.
Organizations should establish consistent data definitions, access permissions, production calendars and reporting rules.
Where facilities have different equipment or production methods, comparisons should account for those differences.
What Makes a Good Factory OEE Dashboard?
A useful dashboard should make important production information easy to understand without overwhelming users.
Clear KPI Visualization
The most important indicators should be easy to identify, with clear labels and consistent definitions.
Machine and Line Drill-Down
Users should be able to move from an overall plant view to a specific production line or machine when investigating an issue.
Reliable Data Collection
The dashboard is only as useful as the data supporting it.
Machine counts, cycle times, downtime events and quality figures should be validated.
Configurable Views
Different users need different levels of detail. Plant leadership may require summarized KPIs, while production supervisors need machine-level information.
Historical Comparison
Access to past performance allows teams to recognize recurring problems and assess improvement initiatives.
Appropriate Access Control
Users should see the information and functions appropriate to their responsibilities.
Integration with Existing Equipment
The system should support suitable methods of collecting data from the factory's existing machines and systems.
Integrating an OEE Dashboard with Existing Machines
A common concern during manufacturing digitalization is whether existing equipment must be replaced.
In many cases, an OEE monitoring solution can work with existing machines if suitable data can be accessed.
Possible data sources include PLCs, machine controllers, sensors, production counters and existing databases.
For older machines, additional sensors or external data collection devices may be required.
The feasibility depends on the equipment, available interfaces, required metrics and operating environment.
A machine assessment before implementation helps determine the appropriate approach and avoid unrealistic expectations about the data available from each asset.
Common Mistakes When Implementing a Factory OEE Dashboard
Focusing Only on OEE
An OEE percentage without supporting downtime, performance and quality information offers limited diagnostic value.
Using Inconsistent Calculations
Comparing machines with different definitions of planned production time or ideal cycle time can produce misleading conclusions.
Overloading the Dashboard
Displaying too many metrics at once can make important information harder to find.
Ignoring Data Validation
Incorrect counts or incomplete downtime records can undermine confidence in the system.
Treating the Dashboard as a Complete Solution
A dashboard identifies and presents information. People and processes are still needed to investigate problems and implement improvements.
Failing to Define Ownership
Every important production issue should have a clear process for investigation, escalation and follow-up.
How to Implement a Factory OEE Dashboard Successfully
A structured implementation can help manufacturers establish reliable monitoring without attempting to digitize every process at once.
Step 1: Define the Objectives
Identify the production problems the dashboard should help address, such as downtime, missed targets or limited machine visibility.
Step 2: Select the Initial Machines
Start with critical machines or production lines where monitoring can provide meaningful operational insight.
Step 3: Assess Available Data
Determine which metrics can be collected automatically and where manual inputs are still necessary.
Step 4: Establish KPI Definitions
Agree on OEE formulas, production schedules, cycle times, quality definitions and downtime categories.
Step 5: Validate the Dashboard
Compare system measurements against verified production records and resolve discrepancies.
Step 6: Train Users
Ensure that plant managers, supervisors and relevant teams understand how to interpret the dashboard.
Step 7: Expand Based on Results
Extend the system to additional machines and production areas after validating the initial implementation.
This approach creates a more reliable foundation for wider deployment.
Measuring the Value of a Factory OEE Dashboard
The value of a dashboard should be evaluated through operational outcomes rather than its visual appearance.
Manufacturers may track indicators such as:
Time required to prepare production reports
Downtime visibility and investigation time
OEE trends
Production target achievement
Quality performance
Machine utilization
Improvement actions completed
For example, if automated reporting reduces the time spent consolidating shift reports, that reduction can be measured against the previous reporting process.
Similarly, if better visibility helps a team identify and address recurring downtime, the resulting operational change can be evaluated using verified production data.
The results will depend on the starting conditions, data quality and effectiveness of the actions taken.
Frequently Asked Questions
What is a factory OEE dashboard?
A factory OEE dashboard displays Overall Equipment Effectiveness and related manufacturing KPIs. It helps teams monitor machine availability, performance, quality, downtime and production output.
Can a factory OEE dashboard monitor multiple production lines?
Yes, a suitably configured system can monitor multiple machines and production lines from a centralized interface. The available views depend on the platform and implementation.
Does an OEE dashboard provide real-time data?
It can provide real-time or near-real-time information when the required data sources, connectivity and update configuration support it. Update frequency varies by implementation.
Which KPIs should plant heads monitor?
Common indicators include OEE, availability, performance, quality, downtime, production target achievement and machine status. The most useful metrics depend on the plant's operational priorities.
Can an OEE dashboard work with older machines?
Potentially. Existing PLCs, counters or additional sensors may provide the required data, but compatibility depends on the machine and its available interfaces.
How does a factory OEE dashboard improve productivity?
It improves visibility into production conditions and losses, helping teams identify where further investigation or corrective action may be required. Productivity improvements depend on the actions taken in response to the information.
Final Thoughts
Manufacturing leaders need a reliable way to understand how equipment, production lines and departments are performing.
A Factory OEE Dashboard brings availability, performance, quality, downtime and production information into a centralized view, making it easier to compare performance and investigate operational issues.
For plant heads, the real benefit is the ability to move from fragmented reports toward consistent production visibility.
When supported by accurate machine data, clearly defined KPIs and a disciplined improvement process, a factory dashboard can become an important part of daily production management.
The most effective solution is one that presents the right information to the right people and helps them take meaningful action on the shop floor.
Improve Visibility Across Your Manufacturing Plant
If your factory needs a clearer view of machine performance, production losses and plant-wide OEE, a centralized monitoring dashboard can help bring critical operational information together.
Request a Demo to explore how OEE monitoring can support production visibility and performance management across your manufacturing operations.